GaWC Research Bulletin 264 |
|
|
|
This Research Bulletin has been published in Tijdschrift voor Economische en Sociale Geografie, 101 (3), (2010), 333-348. doi:10.1111/j.1467-9663.2009.00547.x Please refer to the published version when quoting the paper.
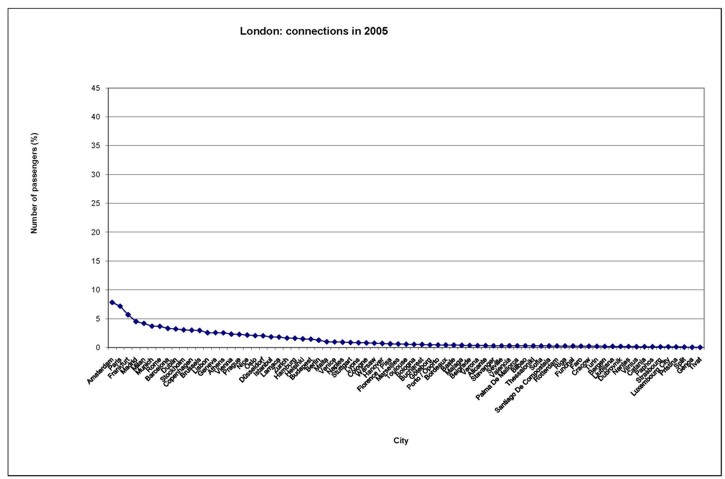
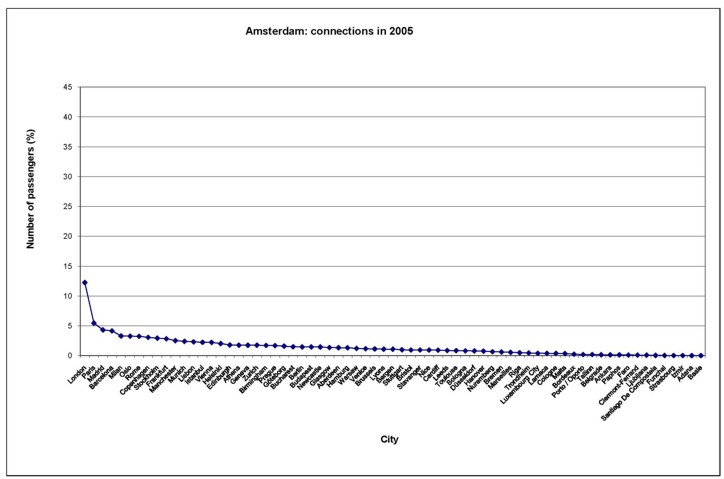
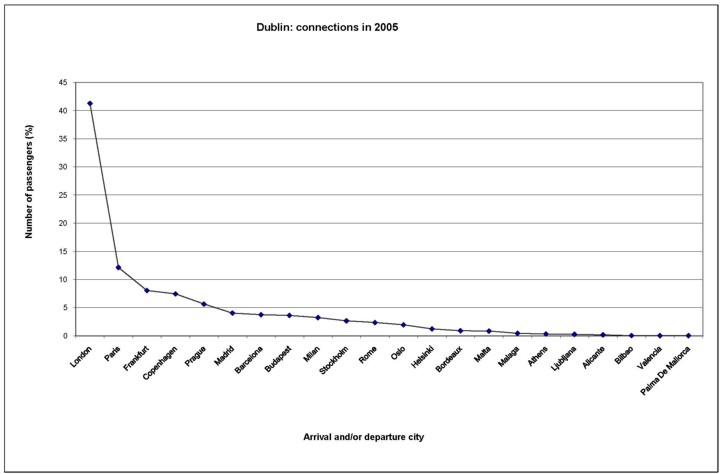
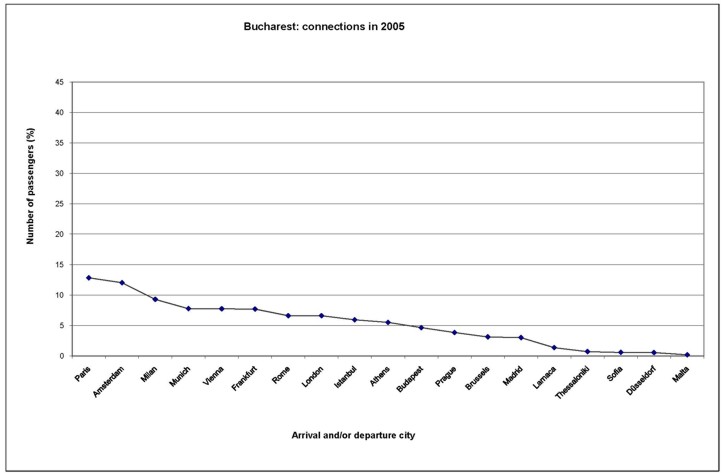
IntroductionIt seems fair to state that there has been a (renewed) interest in human geography in conceptual and empirical research on urban networks (e.g. Frenken & Horkman, 2006; Meijers, 2007; Taylor et al., 2008). Recent empirical studies in this context have often taken on the form of classification exercises that draw on a combination of two sorts of connectivity indicators, i.e. (i) the total connectivity of a city, and (ii) the spatial configuration of a city’s connectivity. The rationale for this dual approach is clearly set out in a paper by Burghouwt and Hakfoort (2002), in which the authors lament the fact that standard airport classifications – such as those provided by the Federal Aviation Administration (2000) – nearly always draw rather simplistically on either the total number of passengers or the total seat capacity of an airport. Although this actually realized or potential capacity provides us with an even-handed measure of an airport’s total connectivity, Burghouwt and Hakfoort (2002) rightly observe that it does not give any indication of the actual spatial configuration of this connectivity. As a consequence, potential differences in the make-up of a given level of connectivity are not taken into account in such classifications. However, an airport that is only directly connected to 1 or 2 other nodes clearly plays another role in the network than an airport that is directly connected to 10 or 20 other nodes, even if both airports have a similar capacity. In their classification of European airports, Burghouwt and Hakfoort (2002) therefore include – in addition to the total seat capacity of an airport – two related variables that gauge the spatial configuration of an airport’s connectivity in the European air transport network: the number of destinations per se and the number of intercontinental destinations. A similar approach to classifying nodes in a network can be found in Taylor & Derudder (2004), in which the authors order European cities based on their position in the world city network created through the globalized location strategies of advanced producer services firms. In this empirical exercise, cities are clustered on the basis of the spatial arrangement of their inter-city relations, after which the various clusters are ordered through the total connectivity of their member cities. Despite the differences in units of analysis (cities versus airports) and the input data (inter-firm flows in the advanced producer services sector versus airline flows), both Taylor & Derudder (2004) and Burghouwt & Hakfoort (2002) take a similar dual approach to the classification of nodes in a spatial network. In this paper, we suggest that their combined use of (i) the total connectivity of a node and (ii) its spatial configuration may be enhanced by considering a third indicator, i.e. (iii) the degree of ‘polarization’ in a node’s connectivity configuration. Polarization hereby refers to the extent to which a node’s connections are (un)evenly distributed. In this context, it is neither a city’s total connectivity nor the spatial structure of its connectivity that is important, but rather the proportional magnitude of its different connections. Figures 1-4 illustrate the relevance of this extra indicator. The figures give an impression of the connectivity profile of four cities in the European air transport network, i.e. London, Amsterdam, Dublin, and Bucharest; the data used in these figures is discussed in some detail in the next section. Taking the dual approach set out in Burghouwt & Hakfoort (2002) and Taylor & Derudder (2004), one would assume that Amsterdam/London on the one hand and Bucharest/Dublin on the other hand take on a similar roles in the European air transport network: (i) a comparable total connectivity (as measured by the total number of intra-European passengers in 2005: 28’182’754 and 17’989’712 for London and Amsterdam respectively, 2’200’234 and 2’206’690 for Dublin and Bucharest respectively) is in both cases matched by (ii) a comparable configuration of this total connectivity (as measured by the number of direct intra-European connections in 2005: 75 and 69 direct European connections for London and Amsterdam respectively, 22 and 19 for Dublin and Bucharest respectively). Figures 1-4 show an ordinal line graph of the overall passenger share of the European cities directly connected to London, Amsterdam, Dublin, and Bucharest. There are clearly quite different patterns in these rank size distributions: flows to/from Amsterdam and Dublin are dominated by a single city (in both cases London), while flows to/from London and Bucharest are far more evenly distributed (there is, for instance, no substantial difference between the importance of the flows to/from the most important and the second most important city). Thus despite having (i) similar levels of connectivity and (ii) this connectivity being distributed over a similar number of nodes, both Amsterdam/London and Dublin/Bucharest are quite different in their connectivity profile. Paraphrasing the observations made in Burghouwt & Hakfoort (2002), one might say that a city whose passengers are primarily directed towards 1 or 2 of the other nodes clearly plays another role in the network than a city whose passengers are rather evenly distributed over 10 or 20 of the other nodes, even if both cities (i) have a similar seat capacity and (ii) are directly connected to a similar number of other cities. Figure 1. Rank size distribution for London in 2005
Figure 2. Rank size distribution for Amsterdam in 2002.
Figure 3. Rank size distribution for Dublin in 2005.
Figure 4. Rank size distribution for Bucharest in 2005.
In this paper, we propose to gauge this third feature of a city’s connectivity profile through a polarization measure that identifies the number of significant flows for each node in the network. The number of significant connections of a node is determined by applying multiple linkage analysis (MLA), a method that is specifically designed for this purpose (Van Nuffel 2007). It should be noted from the outset that ‘significant’ does not have any statistical connotation in this context, we simply use this term generically as a synonym for ‘meaningful’. This paper has two related purposes, one methodological and the other empirical. The methodological purpose is to discuss how the measurement of polarization through MLA may lead to more satisfactory classifications of cities as nodes in urban networks. The empirical purpose of this paper is to illustrate this methodological assertion by broadly replicating the approach employed in Burghouwt & Hakfoort (2002) and Taylor & Derudder (2004), i.e. clustering European cities based on their position in a transnational urban network. More specifically, we classify 65 cities based on their position in the European air transport network in 2002 and 20051. The degree of polarization in a city’s connectivity configuration is hereby considered alongside both traditional measures of connectivity. The remainder of this paper is organized as follows. In the next section, we introduce our dataset and briefly discuss the transformations that were needed to make the data suitable for our analysis. The following section presents the method of MLA and discusses the results of the application of this technique to our air passenger data for 2002 and 2005. The last main section presents the results of the cluster analysis, after which the paper is concluded with a discussion of our main findings and some avenues for further research. THE AEA-DATABASEIn recent years, air passenger data have become very popular, both for analysing transnational urban networks (see e.g. Shin & Timberlake 2000; Smith & Timberlake 2001; Matsumoto 2004; Derudder & Witlox 2005; Derudder et al. 2007a,b; Taylor et al. 2007) and for investigating the effects of deregulation and other changes in the airline industry (see e.g. Philips 1985; Goetz & Sutton 1997; Burghouwt & Hakfoort 2001; Reynolds-Feighan 2001; Burghouwt & Hakfoort 2002; Burghouwt et al. 2003; Frenken et al. 2004; Burghouwt & de Wit 2005; Zook & Brunn 2006; Alderighi et al. 2007; Grubesic & Zook 2007). Numerous authors have used air passenger data to develop classifications of both airports and cities (for an overview, see Burghouwt & Hakfoort 2001, 2002). Description of the AEA-DatabaseIn this paper, we make use of AEA-data. AEA stands for Association of European Airlines, a non-profit-making organisation that brings together 31 major European airlines2. The AEA represents its member airlines in dialogue with all the relevant European and international organisations in the aviation value chain, thus ensuring the sustainable growth of the European airline industry in a global context. (www.aea.be) Through the cooperation of an airline, we were able to obtain an AEA-database that contains, for each connection, information on the carrier, origin and destination (airport, city, country and region), number of passengers (subdivided into first class, business class and economy class), freight, mail, number of flights (subdivided into passenger flights and freight flights) and distance between origin and destination. The data is summarized on a monthly basis for the period January 2001 – April 2006, which allows a detailed analysis of recent data. Obviously, the AEA-data is a very rich source of information. There are, however, two drawbacks that should be taken into account when interpreting the results. The first problem is the fact that the AEA is primarily made up of so-called ‘legacy carriers’, which implies that there are no low-cost carrier members in the AEA. According to the European Low Fares Airline Association (www.elfaa.com), the low-cost carrier sector accounted for approximately 30% of all intra-European traffic in 2006. Contrary to full service carriers who experienced a shift towards hub-and-spoke configurations after the deregulation of the passenger aviation market, low-cost carriers tend to prefer a point-to-point organisation of their air traffic. Not including them will therefore have some influence on the results3. A second, and more important, disadvantage of the AEA-data, and a potential source of distortions and misinterpretations, is the lack of real origin-destination data: the database records the individual legs of a trip rather than the trip as a whole. For example, a flight from Oslo to Madrid via London will be recorded as two separate flights, one from Oslo to London and one from London to Madrid. Any possible stopovers are not registered as such, which implies that the connectivity of cities with an important hub function, like London and Paris, will be overestimated. Transformation of the DataThe AEA-database includes flights within Europe, as well as flights between Europe and other regions. For our research purposes, we only selected those flights where both the origin city and destination city are European cities. Because of some difficulties with the homogeneity of the data for different years4, we only included international flights (i.e. flights between two cities in different European countries). We then converted the airport-to-airport database into a city-to-city database by summing the number of passengers over all the airports for a given city. Cities that do not figure as origin or destination in both 2002 and 2005 (the two years for which we did our analysis)5 were dropped. Finally, given that we do not know the home base of the travelers, we summed the passengers travelling from city A to city B with those travelling in the opposite direction, and grouped the same connections, resulting in a database of non-directional, international flows between cities. After these transformations, our database contains 116,015,489 passengers in 2002 and 128,809,672 passengers in 2005, distributed over 22 carriers6, 35 countries and 129 cities. DETERMINATION OF THE NUMBER OF SIGNIFICANT CONNECTIONS: MULTIPLE LINKAGE ANALYSISMethodMLA is a technique derived from mathematical graph theory. Concepts from graph theory were first introduced in geography by Nystuen & Dacey (1968), when they used primary linkage analysis to reconstruct the urban hierarchy in Washington State on the basis of intercity telephone calls. In primary linkage analysis, only the dominant flow is taken into account: “the ‘dominant association’ remains the critical concept in defining a nodal structure. The remaining, non-dominant associations are not used, even though the magnitudes of some of these associations may be relatively large” (Nystuen & Dacey 1968, p. 408). Not surprisingly, neglecting subdominant flows is at the heart of the critique on primary linkage analysis (e.g., Guldmann 2004). MLA is an extension of primary linkage analysis, developed to deal with subdominant flows that are important for the spatial structure (Puebla 1987). To distinguish significant from insignificant flows, all flows to/from a spatial unit are ranked from largest (w1) to smallest (wk). A set of cycles of expected flows {ŵi}, with i ϵ I (the set of spatial units), is then generated as follows (Haggett et al. 1977): 1st cycle:
2nd cycle:
jth cycle (j < k):
kth cycle: The goodness of fit between the set of observed flows and each of the sets of expected flows is measured by the coefficient of determination (r²)7. The number of significant flows corresponds to the jth cycle with the highest r² value. This number indicates how many of the flows that are connected with a particular spatial unit (in our case: a city) are really meaningful in the specification of the spatial structure of the spatial unit concerned. In other words, the results of the MLA allow for a sound (i.e. without loss of relevant information) reduction of the flow data. ResultsWe calculated the number of significant connections for each of the 129 cities in our database, but only the results for the 73 European so-called GaWC world cities8 will be discussed below. The determination coefficients of Dublin, Amsterdam, Bucharest and London for each consecutive cycle are given in Table 1. For Dublin and Amsterdam, the highest coefficient of determination (0.93 and 0.75 respectively) is found between the observed flows and the first cycle of expected flows, which conforms to the intuitive interpretation of Figures 2 and 3 in that the connectivity profile of both cities is dominated by a single city (London). In the case of Bucharest, it is the 10th cycle of expected flows that has the highest coefficient of determination, while for London it is the 18th cycle. Again, this conforms to the intuitive interpretation of Figures 1 and 4 in that the connectivity profile of both cities shows a rather steady decline. The MLA-values thus lead to the general conclusion that the polarization in the connectivity profile of Dublin and Amsterdam is high, whereas the polarization in the connectivity profile of Bucharest and London is relatively low. Table 1. Coefficients of determination between the number of observed flows and the number of expected flows for Dublin, Amsterdam, Bucharest and London in 2005 (highest value marked in bold).
Table 2 shows the number of significant connections for each of the cities in 2002 and 2005. With a few exceptions (the most striking ones are Amsterdam and Frankfurt, two cities that have dominant connections towards London and – to a lesser extent – Paris), the most important cities (in terms of total number of passengers) also have the largest number of significant connections. Table 3 gives an overview of the two most significant connections of a city, albeit that only those cities that are the first or second connection for more than one city are listed. London clearly dominates the list: in 2002, it is the most significant connection for 24 of the 73 cities, and the second connection for 11 of the 54 cities that have more than one significant connection. Paris leads the ranking of the second connections in 2002. The city also comes second in the list of the first connection cities. Other important cities are Amsterdam, Frankfurt and Copenhagen for the first connection, and Frankfurt, Munich and Amsterdam for the second connection. The list for 2005 is very similar to the one for 2002, albeit that Paris seems to gain in importance at the expense of London. The most striking change in the ranking is the rise of Munich: while it is the first connection only for Ankara in 2002, in 2005 it comes fourth in the list of first connections. Between 2002 and 2005, 34 cities show no change in their number of significant connections. Of the remaining 39 cities, the majority (25) have a larger number of significant connections in 2005 than in 2002, while the other 14 show a decrease. In most cases, this increase/decrease parallels an increase/decrease in the number of passengers and destinations. The exceptions are marked in bold in Table 2. Both Stuttgart and Turin have only one significant connection more in 2005 than in 2002. Nevertheless, the number of destinations decreases with two for Stuttgart and with one for Turin, and the number of passengers shows a slight decrease for Stuttgart and stays about the same for Turin. The number of significant connections for Birmingham, Bordeaux, Luxembourg City, Nuremberg and Sarajevo is less in 2005 than it is in 2002, notwithstanding the fact that both their number of passengers and their number of destinations increase. These exceptions are however not that important: the difference between 2002 and 2005 is only one significant connection. Table 2. Number of significant connections according to MLA.
Table 3. Frequency of cities that figure as first and second connections in 2002 and 2005.*
* only cities that appear more than once are listed A CLASSIFICATION OF EUROPEAN CITIESFollowing Burghouwt & Hakfoort (2002) and Taylor & Derudder (2004), we classify our sample of European cities using a hierarchical cluster analysis.9 Only cities that had at least three connections in both 2002 and 2005 were included. This criterion reduced the number of cities from 73 to 65.10 Following our argumentation in the introduction, we used three variables in the cluster analysis: (i) the total number of international passengers within Europe as a measure of total connectivity, (ii) the total number of European connections as a measure of the configuration of this connectivity, and (iii) the number of significant European connections (as determined by MLA) as a measure of polarization. We first standardized the values of the three variables by calculating z-scores for each of the cities. We performed two analyses, one for 2002 and one for 2005. After comparing different cluster solutions, we selected the five cluster solution because this gave the best interpretable result in terms of grouping of cities. Table 4 shows the average values of each variable for each cluster in 2002. Table 5 shows the same results for 2005. In between brackets we indicated with plus and minus signs the degree to which the average value of the variables for the cities in the cluster differs from the average value for all cities taken together. Since most passenger distributions are positively skewed (a lot of relatively small values and a few exceptionally large ones), we used different criteria for deviations above and below the mean. Positive deviations from the mean are indicated with ‘+’ if they are smaller than one standard deviation, with ‘++’ if they are between one and two standard deviations, and with ‘+++’ if they are larger than two standard deviations. Negative deviations from the mean are indicated with ‘-’ if they are larger than the median, with ‘--’ if they are smaller than the median but larger than the 40th percentile, and with ‘---’ if they are smaller than the 40th percentile. For ease of interpretation, we renumbered the clusters according to increasing average number of passengers, cluster 1 being the cluster with the lowest average number of passengers, and cluster 5 being the cluster with the highest average number of passengers. For each cluster, we also give two ‘representative’ examples of cities that are a member of that particular cluster. Table 4. Cluster results for 2002.
+: less than one standard deviation above the mean, ++: between one and tow standard deviations above the mean, +++: more than three standard deviations above the mean, -: smaller than the mean but larger than the median, --: smaller than the median but larger than the 40th percentile, ---: smaller than the 40th percentile.
Table 5. Cluster results for 2005.
+: less than one standard deviation above the mean, ++: between one and tow standard deviations above the mean, +++: more than three standard deviations above the mean, -: smaller than the mean but larger than the median, --: smaller than the median but larger than the 40th percentile, ---: smaller than the 40th percentile.
The cluster with the largest number of cities is cluster 1, a cluster that is largely below average for each of the variables. Cluster 2 is the cluster that resembles most the mean values for all cities together (last row in tables 3 and 4). In total, 19 cities belong to this cluster in both 2002 and 2005. Cluster 3 is slightly above average for all variables. Clusters 4 and 5 are both strongly above average for the mean number of passengers and the mean number of destinations. However, the two clusters differ with regard to their average number of significant connections: while cluster 4 is clearly below average for the number of significant connections (the mean of the number of significant connections is 2, the same as for cluster 1), cluster 5 has the highest value of all clusters for the average number of significant connections, namely 7 in 2002 and 10 in 2005. The detailed composition of the clusters is given in the appendix. The three largest clusters (clusters 1, 2 and 3) seem to be distinguished mainly on the basis of the number of passengers and the number of connections (cluster 3 having the largest average number of passengers and connections, cluster 1 having the smallest). The two smaller clusters (clusters 4 and 5) consist of the most important (in terms of number of passengers) cities: London, Paris, Frankfurt, Amsterdam and – in 2005 – Munich. The first two cities belong to cluster 5, the last two (three in 2005) to cluster 4. All five major cities are largely above average for both number of passengers and number of connections. It is the number of significant connections that is responsible for the distinction between the two clusters. When the analyses are repeated without this variable, in 2002, Paris is added to the Amsterdam-Frankfurt cluster, while London forms a cluster of its own. In 2005, the four cities are grouped in one cluster. In both years, Munich is part of a separate cluster with Brussels, Copenhagen, Milan and Vienna. Since, as we argued in the introduction, polarization can be considered an important aspect of the spatial organization of the airline network, taking into account the number of significant connections appears to be useful in classifications of cities on the basis of air passenger data. Although roughly the same clusters can be distinguished in 2002 and 2005, their composition is somewhat different. Table 6 summarizes the changes; 15 out of the 65 cities are in a different cluster in 2005. Ten of them go up in the ranking: four cities go from cluster 1 to cluster 2, five cities go from cluster 2 to cluster 3, and one city goes from cluster 3 to cluster 4. Five cities go down in the ranking: three go from cluster 3 to cluster 2 and two go from cluster 2 to cluster 1. The changes are rather limited: no city changes two or more levels in the ranking, which confirms the robustness of our method. Table 6.
CONCLUSIONIn their cluster analysis of European airports, Burghouwt & Hakfoort (2002) make use of variables that measure both connectivity and its configuration based on air passenger flows. Although their analysis is a clear-cut improvement over former typologies that only focus on connectivity in the strict sense, in this paper, we argued that their approach can be further refined by including an additional indicator of what we call ‘polarization’, i.e. the extent to which one or only a few connections dominate a city’s connectivity profile. The concept of polarization was implemented through determining the number of significant connections, which was measured by multiple linkage analysis (MLA). The results of the MLA show that, in general, the most important cities also have the largest number of significant connections. London and Paris outrank by far the other cities in the ranking of the two most significant cities of the 73 European cities. Between 2002 and 2005, the changes in the number of significant connections parallel in most cases the changes in the number of passengers and the number of European connections. The seven exceptions are rather unimportant, since the change in number of significant connections is only one. We then included the number of significant flows as one of the variables in a cluster analysis of 65 European cities. In 2002, as well as in 2005, the three largest clusters seem to be distinguished mainly on the basis of the number of passengers and the number of connections. On the other hand, the two smallest clusters, containing the most important cities in terms of air passenger flows, are primarily differentiated on the basis of the number of significant connections, i.e. on the basis of the polarization of the cities of which they are composed. While Frankfurt and Amsterdam (and Munich in 2005) are mainly directed to London and Paris, the latter two cities show no clear signs of polarization. The differentiation between clusters 4 and 5 would not have been made if the number of significant flows had not been taken into account. It thus seems that including the number of significant flows as an indicator of polarization in an analysis of relations between cities can enhance our understanding of the spatial structure of the city network. REFERENCESAEA (Association of European Airlines) (2003), Yearbook 2003. www.aea.be ALDERIGHI, M., A. CENTO, P. NIJKAMP & P. RIETVELD (2007), Assessment of New Hub-and-Spoke and Point-to-Point Airline Network Configurations. Transport Reviews 27, pp. 529-549. BURGHOUWT, G. & J. DE WIT (2005), Temporal Configurations of European Airline Networks. Journal of Air Transport Management 11, pp. 185-198. BURGHOUWT, G. & J. HAKFOORT (2001), The Evolution of the European Aviation Network, 1990-1998. Journal of Air Transport Management 7, pp. 311-318. BURGHOUWT, G. & J. HAKFOORT (2002), The Geography of Deregulation in the European Aviation Market. Tijdschrift voor Economische en Sociale Geografie 93, pp. 100-106. BURGHOUWT, G., J. HAKFOORT & J. RITSEMA VAN ECK (2003), The Spatial Configuration of Airline Networks in Europe. Journal of Air Transport Management 9, pp. 309-323. DERUDDER, B. & P.J. TAYLOR (2005), The Cliquishness of World Cities. Global Networks 5, pp. 71-91. DERUDDER, B. & F. WITLOX (2005), An Appraisal of the Use of Airline Data in Assessing the World City Network: A Research Note on Data. Urban Studies 42, pp. 2371-2388. DERUDDER, B., L. DEVRIENDT & F. WITLOX (2007a), Flying where You don’t want to go. An empirical analysis of hubs in the global airline network. Tijdschrift voor Economische en Sociale Geografie 98, pp. 307-324. DERUDDER, B., F. WITLOX & P.J. TAYLOR (2007b), US Cities in the World City Network. Comparing their Positions using Global Origins and Destinations of Airline Passengers. Urban Geography 28, pp. 74-91. FEDERAL AVIATION ADMINISTRATION (FAA) (2000), Airport Activity Statistics of Certificated Air Carriers: Summary Tables 2000. http://www.bts.gov. last accessed 15/12/2007. FRENKEN, K., S. VAN TERWISGA, T. VERBURG & G. BURGHOUWT (2004), Airline Competition at European Airports. Tijdschrift voor Economische en Sociale Geografie 95, pp. 233-242. FRENKEN, K. & J. HOEKMAN (2006), Convergence in an enlarged Europe: the Role of Network Cities. Tijdschrift voor Economische en Sociale Geografie 97, pp. 321–326. GOETZ, A.R. & C.J. SUTTON (1997), The Geography of Deregulation in the U.S. Airline Industry. Annals of the Association of American Geographers 87, pp. 238-263. GRUBESIC, T. & M. ZOOK (2007), A Ticket to Ride: Evolving Landscapes of Air Travel Accessibility in the United States. Journal of Transport Geography 15, pp. 417-430. GULDMANN, J.-M. (2004), Spatial Interaction Models of International Telecommunication Flows. In: M.F. Goodchild & D.G. Jannelle, eds., Best Practices in Spatially Integrated Social Science, pp 400-442. Oxford: Oxford University Press. HAGGETT, P., A. CLIFF & A. FREY (1977), Locational Analysis in Human Geography. London: Edward Arnold. HAIR, J.F., R.E. ANDERSON, R.L. TATHAM & W.C. BLACK (1998), Multivariate Data Analysis. 5th edition. London: Prentice Hall. HOAG, L.P. (1969), The Weaver Method: An Evaluation. Professional Geographer 21, pp. 244-246. JOHNSON, L.J. (1969), Further Comments on Weaver’s Method. Professional Geographer 21, pp. 246-247. MATSUMOTO, H. (2004), International Urban Systems and Air Passenger and Cargo Flows: Some Calculations. Journal of air Transport Management 10, pp. 241-249. MEIJERS, E. (2007), From Central Place to Network Model: Theory and Evidence of a Paradigm Change. Tijdschrift voor Economische en Sociale Geografie 98, pp. 245–259. NYSTUEN, J.D. & M.F. DACEY (1968), A Graph Theory Interpretation of Nodal Regions. In: B.J.L. Berry & D.F. Marble, eds., Spatial Analysis. A Reader in Statistical Geography, pp 407-418. New Jersey: Prentice Hall. PHILIPS, L.T. (1985), Structural Change in the Airline Industry: Carrier Concentration at Large Hub Airports and its Implications for Competitive Behavior. Transportation Journal 25, pp. 18-28. PUEBLA, J.G. (1987), Spatial Structures of Network Flows: a Graph Theoretical Approach. Transportation Research B 21, pp. 489-502. REYNOLDS-FEIGHAN, A. (2001), Traffic Distribution in Low-Cost and Full-Service Carrier Networks in the US Air Transportation Market. Journal of Air Transport Management 7, pp. 265-275. SAEY, P. (1976), Kritische Handleiding bij de Geografische Literatuur over Lokalisatietheorieën, Volume 1: Beschrijven. Gent: Publicaties van het Seminarie voor Menselijke en Ekonomische Geografie der Rijksuniversiteit Gent, nr. 12/A. SHIN, K.-H. & M. TIMBERLAKE (2000), World Cities in Asia: Cliques, Centrality and Connectedness. Urban Studies 37, pp. 2257-2285. SMITH, D.A. & M. TIMBERLAKE (2001), World City Networks and Hierarchies, 1977-1997: An Empirical Analysis of Global Air Travel Links. American Behavioral Scientist 44, pp. 1656-1678. TAYLOR, P.J. (2001), Specification of the World City Network. Geographical Analysis 33, pp. 181-194. TAYLOR, P.J. (2004), World City Network: A Global Urban Analysis. London and New York: Routledge. TAYLOR, P.J. & M. HOYLER (2000), The Spatial Order of European Cities under Conditions of Contemporary Globalization. Tijdschrift voor Economische en Sociale Geografie 91, pp. 176-189. TAYLOR, P.J. & B. DERUDDER (2004), Porous Europe: European Cities in Global Urban Arenas. Tijdschrift voor Economische en Sociale Geografie 95, pp. 527-538. TAYLOR, P.J., G. CATALANO & D.R.F. WALKER (2002), Measurement of the World City Network. Urban Studies 39, pp. 2367-2376. TAYLOR, P.J., B. DERUDDER & F. WITLOX (2007), Comparing Airline Passenger Destinations with Global Service Connectivities: A Worldwide Empirical Study of 214 Cities. Urban Geography 28, pp. 232-248. TAYLOR, P.J., M. HOYLER & R. VERBRUGGEN (2008), External Urban Relational Process: Introducing Central Flow Theory to Complement Central Place Theory. GaWC Research Bulletin 261. VAN NUFFEL, N. (2007), Determination of the Number of Significant Flows in Origin-Destination Specific Analysis. The Case of Commuting in Flanders. Regional Studies 41, pp. 509-526. WEAVER, J. C. (1954), Crop Combination Regions in the Middle West. Geographical Review 44, pp. 175-200. WITLOX, F. & B. DERUDDER (2007), Airline Passenger Flows through Cities. Some New Evidence. In: P.J. Taylor, B. Derudder, P. Saey & F. Witlox, eds., Cities in Globalization. Practices, Policies and Theories, pp. 37-51. London and New York:: Routledge. ZOOK, M.A. & S.D. BRUNN (2006), From Podes to Antipodes: Positionalities and Global Airline Geographies. Annals of the Association of American Geographers 96, pp. 471-490. NOTES* Nathalie Van Nuffel, Ben Derudder & Frank Witlox, Geography Department, Ghent University, Krijgslaan 281/S8, B9000 Gent, Belgium. Email: nathalie.vannuffel@fulladsl.be, ben.derudder@ugent.be, frank.witlox@ugent.be 1. Note that we cluster cities rather than airports. Both the differences in spatial units being clustered (cities versus airports), and the differences in data used (actual number of passengers versus seat capacity) make a direct comparison of our results with those of Burghouwt & Hakfoort (2002) impossible. These differences do however not hamper our analysis, since our aim is to make a methodological point, rather than compare our results with previous analyses. 2. Situation in February 2008. 3. However, the distortion will probably not be very large. The results of a recent empirical analysis by Alderighi et al. (2007) indicate that the spatial network configuration of full service carriers and low-cost carriers is very similar. On the other hand, their temporal configuration is very different: by adopting a wave-system structure in the airline flight schedule, full service carriers show high temporal concentration, whereas low-cost carriers have almost a zero temporal concentration. 4. Between 2003 and 2004, the number of passengers shows a major increase, mainly caused by a growth in domestic passengers (passengers flying within one country), which is due to a change in the registration procedure. 5. We preferred using data for 2002 instead of 2001 to avoid distortions due to the terrorist attacks of 11 September 2001. According to the AEA, the severe drop in air traffic after 11 September stabilized by the end of 2001, and by March 2002, traffic had almost returned to previous year’s levels (AEA 2003). 6. We only included those carriers that provide data for both 2002 and 2005. Moreover, some carriers only serve intercontinental flights or only freight flights. This explains why not all 31 AEA member airlines are present in our resulting database. 7. In fact, MLA is an extension and improvement of Weaver’s combination index (Weaver 1954; Haggett et al. 1977; Saey 1976). The Weaver method uses the sum of the squared differences (instead of the coefficient of determination) between the fictive and the real percentages. The number of significant flows corresponds to the jth cycle with the smallest sum of the squared differences. For a discussion of the value of the Weaver method, which seems to occasionally produce problematic results, see Hoag (1969) and Johnson (1969). 8. http://www.lboro.ac.uk/gawc/datasets/da11_2.html (last accessed on 11 February 2008). The GaWC Study Group (cf. footnote 1) takes a relational stance in analysing the world city network. Generally speaking, global inter-city matrices can be constructed in two different ways, which may be labelled the corporate organization approach and the infrastructure approach. The GaWC world cities we used in this paper are part of a list of 315 cities that is based on the corporate organization approach. This approach “is premised on the observation that inter-city relations are primarily created by firms that pursue global strategies and are thus prime world city agents.” (Witlox & Derudder 2007, p. 39). For more information on the method, which makes use of data on the office networks of advanced producer service networks, see Taylor (2001, 2004), Taylor et al. (2002) and Derudder & Taylor (2005). 9. We used Ward’s method which minimizes the within-group variation by calculating at each step of the clustering procedure the sum of squares between each two clusters summed over all variables, and joining those two clusters that result in the smallest increase in this sum (Hair et al. 1998). 10. The following less important cities were left out: Bratislava, Cardiff, Cracow, Genoa, Palermo, Rotterdam, Southampton and Trieste. APPENDIX: COMPOSITION OF THE CLUSTERS
Note: This Research Bulletin has been published in Tijdschrift voor Economische en Sociale Geografie, 101 (3), (2010), 333-348 |
||||||||||||||||||||||||||||||||||||||||||||||||||||||||||||||||||||||||||||||||||||||||||||||||||||||||||||||||||||||||||||||||||||||||