GaWC Research Bulletin 263 |
|
|
|
This Research Bulletin has been published in H.S. Geyer (ed) (2009) International Handbook of Urban Policy, Volume 2: Issues in the Developed World, Cheltenham, UK, Edward Elgar, pp. 74-102, under the title 'World Cities: Organizational Networking and the Global Urban Hierarchy'. Please refer to the published version when quoting the paper.
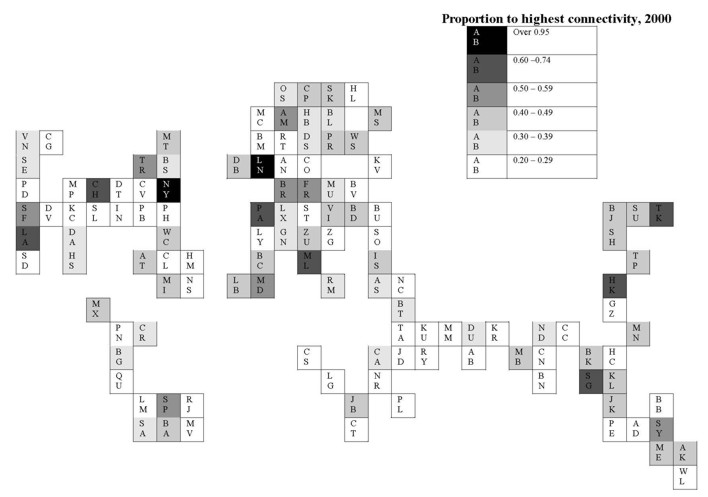
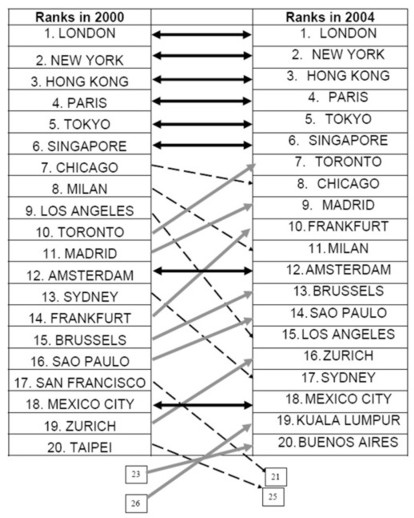
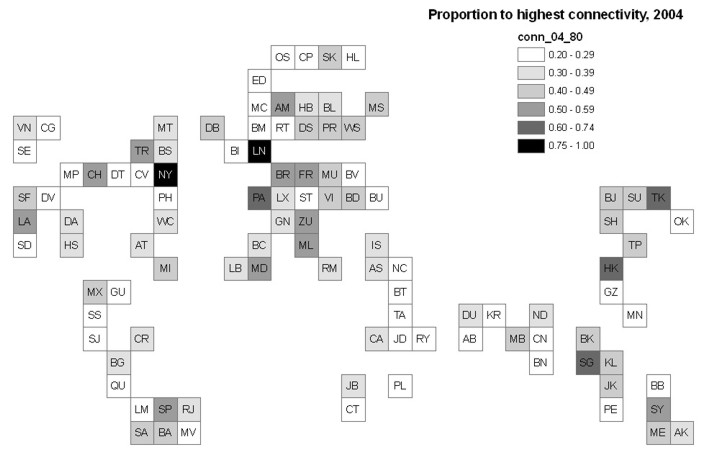
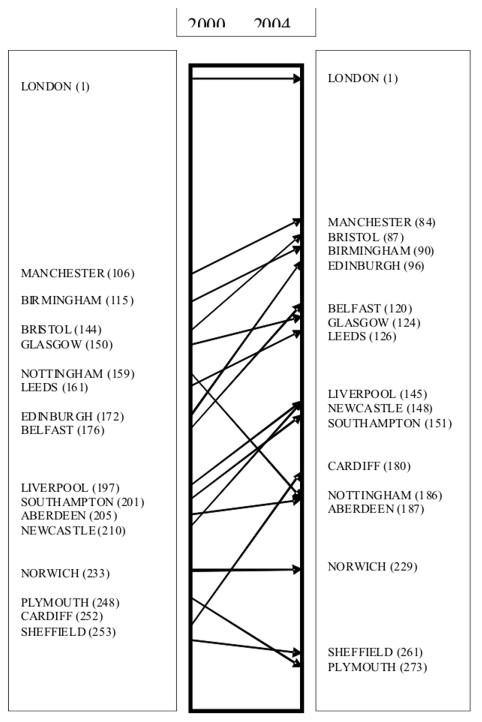
IntroductionUrban studies is a field of inquiry that has ‘gone global’ in the last quarter of a century or so. Three particular developments in the 1970s heralded this ‘up-scaling’ of what had previously been considered to be largely ‘local studies’. First, the breakdown of the Bretton Woods settlement in 1971 led to worldwide financial markets and a consequent interest in major cities as ‘international financial centres’. Second, the rise of multinational corporations and the new international division of labour led to interest in cities as ‘control and command centres’, city concentrations of corporate headquarters. Third, one particular corporate sector, the airline companies, were extending international flights to such a degree that they were seen as constituting worldwide networks connecting cities across all continents. In the 1980s and 1990s these developments became part of the macro-social process that we know as globalization. And cities became integral to understanding this potentially epochal change as signalled by the development of a large and vibrant world cities literature. Further, there were early assertions that cities would the key winners since this globalization ‘unbound’ them from their overarching states (Knight and Gappert, 1989). The development of a new literature is never a straightforward process. There is the basic question of what concepts and ideas are brought forward from existing literatures on the subject. In this case the question was especially pertinent since the literature was part of a wider view concerning a fundamental shift in the organization of society. How new the world city literature should be would be a function of how fundamental a change globalization was deemed to be. Since there were many different positions on the latter, the newness of the world city literature was very variable. This may be a recipe for vibrancy through debate but it is also a cause of uncertainty and confusion. The result was not just a contested literature but one that attracted extremely damning critiques. The world city literature was vulnerable to such critiques on two essential grounds. First, the confusion manifested itself conceptually; there appeared to be numerous alternative ways of describing cities and their inter-relations but without fully respecting the different meanings that these choices indicated. Clarification is attempted in the first section. Second, there was a data crisis in the literature; partly related to conceptual confusion, the evidential basis of the literature was found to be severely wanting. This is addressed in the second section below. It is only after we have cleared away this obscuring brushwood that we can develop some theoretically informed empirical results on world cities in globalization. These are presented in three empirical sections that focus on inter-city connectivities: (i) describing the contemporary world city network; (ii) exploring the mega city-region concept; and (iii) using this way of thinking to critique an example of national spatial planning. A short conclusion draws out the main points of the argument. CLARIFYING BASIC CONCEPTSThe purpose of this section is not to close down debate: there will be many viable ways of understanding world cities in globalization. However, there is a need for a consistent approach to the subject in which the development of theory and empirical analyses iterate in a mutually beneficial manner. In this chapter I present one way in which this may be achieved. Only when a degree of consistency is managed can any approach be fruitfully compared to alternative conceptualisations. I focus on three contested ideas that are at the heart of the argument: globalization, world cities, and cities as process. Contemporary GlobalizationAt its most elementary, globalization refers to a specific geographical scale of activity. This scale, the ‘global’, is sometimes contrasted with the ‘local’ but more often the contrast is with the nation-state scale. In fact, the latter is often portrayed as the victim of a pincer movement with social processes previously concentrated at the state scale ‘leaking’ upwards to the global and downwards to the local. It is certainly true that there is a contemporary restructuring of some state functions in this way and the new concept of ‘glo-calisation has been coined to emphasize their inter-relatedness. Further this might appear as superficially attractive to studies of cities in globalization since cities are commonly identified as the local in glocalization. But for un-derstanding cities this is rather too simple. If globalization is merely ‘up-scaling’ to a worldwide level then the process is not that contemporary. International relations had been largely European in the nineteenth century but towards the end of that century first the USA and then Japan emerged as major powers to produce a new scale of ‘global conflict’ culminating in two world wars in the twentieth century (Bartlett, 1984). The United Nations – an almost universal club of states - was a key product of the second world war and in one key text, 1945 is identified as the most prominent date for the beginning of globalization (Held et al., 1999). I have labelled this section ‘contemporary’ globalization to distance the argument from this naïve political up-scaling argument. There are two key reasons not to pursue this approach. First, the political changes are international in nature; they are about relations between states being extended worldwide. There is no doubt that this was important a century ago but it is not globalization as understood today. A key point about contemporary globalization is that it is based upon trans-state processes, actions that are not organized by states but which transcend state boundaries. For instance, it has been pointed out that world trade in 1913 was at least as large in relative terms as its equivalent in the 1990s. But the difference is that in contemporary globalization international trade statistics are no longer credible data for understanding the world economy. A large proportion of ‘international trade’ is now intra-firm as large corporations transcend boundaries in their global production strategies. Globalization is not international relations; worldwide financial markets through cities are the best illustration of this position. Second, the implication of emphasizing trans-state processes is that globalization is a new spatial organization. This is Castells’ (1996) seminal argument on the construction of social spaces. He argues that before globalization the dominant spatial form was a space of places – the notable example being the world political map of states upon which international relations are premised. However, new enabling technologies – the combination of communication and computing industries in the 1970s – have led to a new dominance of space of flows. It is the internet that allows corporations to have truly global strategies since it provides for worldwide simultaneity in social interactions. It is this global space of flows that is globalization. According to Castells it operates at three levels: (i) the infra-structural level, mainly electronic enabling technology (cable and satellite) but also air travel; (ii) social relations, importantly including routine work practices in corporations; and (iii) the increasingly ghettoised spaces of the super-rich, a transnational economic elite (Sklair, 2002). Ironically it was a political event that brought this globalization to the fore in the public consciousness. Through the 1970s and 1980s the Cold War with its myth of ‘three worlds’ - First, Second, and Third (Worsley, 1984) – obscured the unrelenting rise of a global space of flows and therefore it was not until the demise of the USSR and end of the Cold War that globalization became the buzzword of the 1990s. Johnny-come-lately it might have been, but the buzzword has proved to be resilient: globalization remains the favoured term to describe our contemporary world. World CitiesThe concept of a ‘world city’ has a long lineage in many languages but the contemporary concern for such prominent urban locales is usually dated to Hall’s (1966) book World Cities. This described six major city regions and with Hymer’s (1972) political economy approach to cities worldwide and Reed’s (1981) focus on cities as financial centres, formed the basis of a world cities literature that developed in the 1980s and blossomed in the 1990s. Two writers have dominated this literature: John Friedmann and Saskia Sassen. While contributions of both have been invaluable their works each left an important problem legacy. Friedmann’s interventions (1986, 1995; Friedmann and Wolff, 1982) provided a global vision for urban studies. Cities were viewed as command and control centres of global corporations in their management of the new international division of labour. Friedmann produced an argument that successfully integrated the local (cities) with the global (world-economy) as a ‘world city hierarchy’. This image of the city in globalization came to dominate the literature. And therein lay a problem. What Friedmann had done was to upscale the basic state-level modelling of inter-city relations to the global scale: national urban hierarchy became world city hierarchy. But there was no empirical basis for the hierarchical premise – we return to this question in the next section. Sassen (1991/2001, 1994/200/2004) in two very influential books largely accepted Friedmann’s hierarchical position but emphasized the role of advanced producer services. These financial, professional and creative firms were concentrated in great cities that acted as both production centres and the markets for the services. Thus she coined the concept of ‘global city’ to describe a few cities that acted as ‘strategic places’ for servicing global capital. She focussed upon New York, London and Tokyo; no list of such cities was produced but it was implied that there were only a few global cities across the world, perhaps 20 or so. Her argument was that such cities are unique to globalization; they are not world cities as previously known but rather a special product of contemporary globalization. Sassen provides a basic process for understanding contemporary world cities but in describing them as exclusively global she had created a problem. Her work attracts the question: which cities are global cities with the implication that the rest are in some sense ‘un-global’. This is unfortunate since globalization is a bundle of processes that impinge upon the development of all cities in all countries; there are no non-global cities. Phrases developed to counter Sassen’s exclusivity are ‘globalizing cities’ (Marcuse and van Kempen, 2000) and ‘cities in globalization’ (Taylor et al., 2006) both of which suggest a more inclusive approach. Sassen’s exclusivity is related to Friedmann’s hierarchical postulate; both can be transcended together. Cities As ProcessWhat we get from the seminal work of both Friedmann (1986) and Sassen (1991) is a strong sense of cities as place. Castells (1996), on the other hand, treats cities as process, and in this he follows the influential urbanist Jane Jacobs (1969). As you might expect from Castells, this argument leads to a focus on flows in relation to place. He conceptualises cities as a continuous network process of spatial interactions with place reduced to the role of node within the networks. This position is important in two respects. First, for world cities there is no presumption of a hierarchical arrangement. This is not a simple organizational or semantic matter – whether we describe cities as networked or hierarchical has critical implications about the nature of relations (Thompson, 2004). Hierarchies are there to be climbed and hence incorporate a competitive relation between cities – there is a whole ‘cities competition’ literature built upon this assumption. In complete contrast, a network can only develop and prosper through mutuality between its components: in this case there is a premise for the cooperative nature of cities. Clearly the implication of these two contrary positions for urban policy and planning are fundamental. Here in this chapter, the mutuality argument is assumed, with the existence of ‘hierarchical tendencies’ relegated to an empirical question. Second, as a networked process, all cities have or had the potential to be integrated into networks. Following Jacobs (1969) we might expect at any one time for some cities to be dynamic and others to be stagnant but we do not expect a small elite group of cities separated from the rest; networks do not operate in boundaries. The global city concept is essentially hierarchical and therefore not the city process we develop below. Since we treat cities as networked process we shall try and understand world cities as a world city network. But before we come to that there is the not inconsequential matter of the empirical deficit in the world city literature. THE EVIDENTIAL CRISISIn the 1990s the evidential crisis in the world cities literature was so severe that Cox (1997) even questioned whether world cities actually existed. From within the literature Short (et al., 1996) referred to the dearth of relevant data as ‘the dirty little secret’ of world city researchers. There are actually three key questions that have contributed to this crisis: (i) the nature of the main source of social data; (ii) the nature of the resulting data; and (iii) the use made of the data. For the study of macro-social change by far the most important source of data is the state – hence the name ‘statistics’. The problem is that what interests state officials and what social scientists need do not always coincide. And this is particularly the case for world cities researchers. For a start, states collect statistics largely on their own territories, there is no institution to collect ‘global statistics’. Of course, the UN publishes a lot of statistics through its various organs but these are invariably international statistics derived from its member states. In addition, states have a penchant for attribute data, counting things in places to describe those places – the census is the classic example. This prime data source typically has little relational data, information on flows. Such data requires an origin, destination and measure of flow size. Trade and migration data are the rare examples of such information but they remain strongly international in nature, as the previous discussion on the limitations of trade data indicated. Thus we can get some information on the relations between the UK and France or the UK and USA but very little on the relations between London and Paris or London and New York. It seems the best that can be done is to search out train and air flight timetables. But New York-London is widely seen as ‘Main Street, World Economy’ – it has its own name NYLON - yet we know so little about it. This is because there is no official body charged with dealing with any city-dyad however important; in this case neither the UK or USA nor London or New York city governments have any statutory reason to concern themselves with collecting statistics on NYLON. Faced with largely attribute data world city researchers have used these statistics to rank cities (Taylor. 1997). There is nothing wrong with ranking, as a simple ordering description it can often provide a useful initial description of cities. But this is not how ranking has been interpreted. The concept of rank has been conflated with hierarchy so that high rankings are assumed to equate with top positions in a world city hierarchy. This conceptual slip completely misses the notion of hierarchy as a power relation: lower rungs do as higher rungs order or instruct (Lukermann, 1996; Taylor, 1997). To describe such power relations requires, not unnaturally, relational data: to assume attributional data in ranked form describes a hierarchy is simply a fallacy. Of course, attributional data are also of limited use for describing and understanding networks. The lesson of this evidential crisis is that world city researchers cannot advance their researches very far using official statistics. The only recourse is to turn to collecting one’s own data specifically geared to world city network modelling needs. But this is a very tall order given the global scope of our studies. It can only be adequately carried out as some form of collective effort. This conclusion was the initial stimulation for developing the Globalization and World Cities (GaWC) Research Network (www.lboro.ac.uk/gawc). The remainder of this chapter describes some GaWC research that has generated data and models, results and theory, on inter-city relations in globalization. WORLD CITY NETWORKMy purpose is to begin to understand contemporary interactions between cities worldwide. Previous sections have indicated conceptual and empirical obstacles in my path. In this section these impediments are addressed. Further I will not consider infrastructural spaces of flows (e.g. internet paths, airline flights) but concentrate on social links that they enable. In particular I will explore the business links between world cities as the critical level two in Castells’ (1996) global space of flows. The key initial task is the specification of inter-city relations at a global scale. This is required in order to cut through the conceptual confusion and to guide the empirical task of measurement. Table 1 confirms the need to know specifically what we are studying. Fifty different ways of describing worldwide inter-city relations are listed from the literature; they indicate a certain casualness of description since different terms imply different meanings. We have already mentioned the network/hierarchy contrast, in Table 1 ‘system’ is the most popular relational term and this brings with it a huge baggage of ideas with it but which are generally not used (e.g. holism, feedback). From the title of this section it can be seen that it is world city network that will be specified below. All three words are chosen precisely: (i) network, not hierarchy or system are previously noted; (ii) city, not merely a node or centre and more specific than the general term ‘urban’; and (iii) world, certainly not international and more than transnational, this refers to our ‘modern world’, as in modern world-system, which has not always been ‘global’ and may not be so in the future, the reason for not using this most popular adjective in Table 1. The world city network is specified as an interlocking network model. The Interlocking Network ModelThe interlocking model is described in detail elsewhere (Taylor, 2001a, 2004) and a summary is provided here to underline the main points of the modelling. The model builds upon Sassen’s (1991) identification of advanced producer services as a cutting edge industry in contemporary globalization. However, instead of focussing on just a few main offices of firms in selected ‘global cities’, the complete office networks of the firms are considered thus bringing in many more cities. It is these business service firms who are the agents in this model: in the everyday conduct of their business (e.g. drawing up an inter-jurisdictional contract; planning a global advertising campaign) firms will use personnel across their office network as and when required. This is a space of flows of information, knowledge, instruction, planning, strategy, video conferencing, face-to-face meetings, etc. that link the high-rise office blocks, ubiquitous to contemporary world cities, across the world. The aggregation of all these flows across myriad financial, professional and creative firms constitutes the world city network. Thus do advanced producer service firms ‘interlock’ cities to create a network. Interlocking networks are unusual because they have three layers (Knoke and Kuklinski, 1982). Most network analysis deals with two layers – the net and nodes that create the net (e.g. a gang as a net with gang members as nodes). In world city network the net is the worldwide set of inter-city relations, the nodes are the cities, and there is an additional sub-nodal level of the firms. The latter are not just additional, they are crucial as the agents, the network makers. Thus in this model it is not the nodes – cities - that make the network, and therefore cities are not reified as actors in their own right. As the agents, it is firms that are the subjects of this research, with cities as the object, the outcome of the process being modelled. The model is formally specified as follows. A universe of m advanced producer service firms located in n world cities is defined. The importance of the office of firm j in city i, which is called the service value of a firm in a city, is vij. Service values for all firms in all cities define a service value matrix. The conjecture behind using these values is that the more important the office the more connections it will generate with other offices in a firm's network. The equation: The remainder of this chapter will illustrate numerous examples of the application of equation (5), city network connectivity. The main initial application, the one for which the model was devised, is measurement of the world city network. Connectivities in the World City NetworkIn order to measure world city network connectivities, the interlocking network model has to be operationalised by the creation of a service values matrix. This requires selection of cities and firms and then production of service values for each firm in every city. Such an exercise was first carried out in 2000 and the data collection exercise is described in Taylor et al. (2002) to which reference should be made for a complete description. 315 cities were selected from past knowledge of firms’ office networks. 100 firms (in accountancy, advertising, banking/finance, insurance, law, and management consultancy) were selected for having multiple office locations in at least 15 different cities worldwide. Service values were coded 0 to 5 with the latter scored for the firm’s headquarter city and zero indicating no office for the firm in that city. The data outcome was a 315 cities x 100 firms array of service values, a total of 31,500 pieces of information on advanced producer service provision across the world in 2000. Figure 1 shows the first world city connectivity map depicting 123 cities with at least one fifth of the highest recorded connectivity (London’s) in 2000 (see equation (5) above). This cartogram shows the dominance of cities in northern America, western Europe and Pacific Asia in the world city network but also indicates that the networking extends into all continents with, for instance, Sao Paulo, Johannesburg and Mumbai being relatively important and other ‘third world’ cities such as Lima, Nairobi and Chennai featuring. This is confirmation that in the twenty first century there exists a world city network interlocked by numerous advanced producer service firms. The data collection exercise was repeated in 2004 so as to measure change in connectivities and assess the stability of the world city network – for details see Taylor and Aranya (2008). In fact the fluidity was found in the firms: only 80 out of the original 100 survived in a comparable form in 2004 meaning that the service values matrix for 2004 was 315 cities x 80 firms. Despite these differences in firms there was relatively strong stability in the network. This was especially the case for the leading 20 cities in terms of connectivity: in Figure 2 there are no changes in the top 6 and only two differences in membership of the top 20. Figure 3 shows the 109 cities with city network connectivities (equation (5)) above 0.2 in 2004, which are comparable to 2000 (Figure 1). Here we can see more changes and these have been further analysed. The results (in Taylor and Aranya, 2008) show just two statistically significant effects in the distribution of connectivity changes: (i) sub-Saharan African cities relatively declined in network integration from 2000 to 2004, and (ii) the same is true of US cities. These two contrasting regions in world-systems terms have experienced similar declines but for different reasons. In Africa this appears to be another indication that the continent is a prime regional loser in economic globalization. The USA result is more complicated: the US is by far the largest national market for advanced producer services which means than many large US firms have less incentive to globalise their offices and hence do not qualify for our data collection (for further discussion of this argument see Taylor and Lang, 2006). Interpretation of City Network Connectivities: A UK Case StudyIt is sometimes hard to get your head round global analyses and therefore a much smaller case study is used to aid in interpreting the meaning of these connectivities in urban planning terms. There are 17 UK cities featured in the global analyses reported above. If we abstract them from the overall analyses we can assess how UK cities are positioned in the world city network and how this has changed between 2000 and 2004 (for further details on this research, see Taylor and Aranya, 2006). These are important questions for UK spatial planning since the country has an archetypal primate pattern of cities. London has dominated other UK cities for centuries and it is one of the main cities worldwide to have prospered immensely in contemporary globalization: for Sassen (1991) it is one of her three ‘global cities’, in our analyses above it records the highest city network connectivity. Is this good news or bad news for other UK cities? Does it mean that advanced producer service firms concentrate their business in London leaving other UK cities as globalization urban backwaters? This certainly seemed to be the case in the 2000 analysis wherein only London appears in the top 100 cities (Birmingham and Manchester appear in Figure 1 but are in the final 23 of cities featured in the diagram). ‘Second cities’ in all other comparable European national economies (Germany, France, Italy, Spain, Netherlands, Belgium) do appear in the top 100 in 2000 which would suggest that London does cast a network ‘shadow’ over cities in the rest of the UK. Despite this initial finding there has been much discussion on the revival of UK provincial cities after many decades of relative decline. Is this a case of city boosterisms with little link to reality or have there been advances for provincial UK cities in recent economic globalization? Table 2 strongly supports the latter position: UK cities are to be found among the cities experiencing positive change between 2000 and 2004. Remarkably, there are 3 UK cities featuring in the 10 most improved connectivity scores, with Edinburgh actually being the most improved of all 315 cities in the data. Along with Cardiff, this may be an effect of UK political devolution but it will also be an effect of Edinburgh consolidating its role as a European financial centre. Bristol, on the other hand, has improved without any political push. And it does not end there: all but three of UK cities report positive change. The results are shown in Figure 4 where we can see that for 2004 there are four UK cities in addition to London in the top 100 worldwide: as well as Manchester and Birmingham moving up, they are joined by Bristol and Edinburgh. These positive results can be interpreted at two levels. First, it is clear that business service provision has appreciably expanded in many UK provincial cities showing that if there were a London globalization shadow it appears to be being lifted. In other words major service firms are expanding their provision to cities beyond London. Second, and more generally, this expansion can be considered as an economic indicator. Firms are only expanding because they are finding new business to do in provincial UK cities. Business services are cutting edge economics and therefore their presence indicates much more than more services: it implies development of vibrant and dynamic city economies. This is a very important finding for UK cities and spatial planning policy makers. MEGA-CITY REGIONSSo far we have treated cities without considering the new urban forms that are emerging into under conditions of contemporary globalization. For instance, Allen Scott (2001) has argued that it is global city-regions rather than global or world cities that are the growth nodes of the world economy. Also called mega-city regions (Hall, 1999), these urban forms can often include several cities and therefore may be polycentric in structure. The interlocking network model has been applied to analysis of mega-city regions in the POLYNET project led by Peter Hall and Kathy Pain (2006). Here one part of this project is reported upon (for more details see Taylor, Evans and Pain (2006, 2008)), plus an additional study that developed out of POLYNET is described as follow-up research (see Taylor et al. (2007) for further details). Variations in Polycentricity in North West EuropeThe POLYNET project compared eight mega-city regions in north west Europe: South East England, the Randstad, Central Belgium, RhineRuhr, the Rhine-Main Region, Northern Switzerland, the Paris Region, and Greater Dublin. The interlocking network model was used to estimate the polycentricity in each of these regions. Operationalising the model required a massive data collection exercise. Research teams for each region collected data on firms in eight sectors, the six used for the world city network plus design consultancy and logistical services. Service values were simplified to a scale of 0 to 3 to make comparisons across teams more consistent. Each team collected data at four geographical scales: (i) the mega-city regional scale; (ii) the national scale; (iii) the European scale; and (iv) the global scale. For the latter two scales all teams used the same cities, drawn from the world city network results; at the other two scales teams chose which cities to include based on their local and national knowledge. In total 1,963 office networks were recorded across 74 city-regional cities, 87 national cities, 25 leading cities at the European scale and 25 leading cities at the global scale. The result was a total of 32 potential service value matrices: one for each geographical scale for each of eight mega-city regions (in the event the Belgium team did not analyse at the national scale so that analyses reported below are from 31 service value matrices). For each city in each mega-city region, its network connectivity (equation (5)) can be computed at four different geographical scales: for city interlocks (equation (3)) with other cities in its region, with national cities, with leading European cities, and with leading cities at the global scale. In Table 3 these city connectivities at the regional scale are shown for the leading six cities in each mega-city region. Thus, in the Randstad Amsterdam is the most connected to other Randstad cities closely followed by Rotterdam, with Utrecht and The Hague some way lower in connectivity. and with Alkmaar and Amersfoort at the bottom. Table 4 shows the same connectivity measures but at the opposite end of the scale, the links to leading cities at the global scale. Note immediately that in every analysis in Table 4, the decline in connectivity from the leading city in the region is much more rapid at this scale. For instance, even though the Randstad’s second city has a high connectivity of 0.91 within its region, at the global scale Rotterdam falls to 0.68 indicating the increased importance of Amsterdam in terms of global links. Polycentricity can be computed from these results as shown on both tables. This is measured as simply the average connectivity of the five cities in each region ranked below the leading city. In this scale from 0 to 1 the latter represents pure polycentricity where all six cities have equal connectivity whereas zero results from pure primacy when all connectivity resides in the leading city. In these two tables it is RhineRuhr at the regional scale that is closest to pure polycentricity with an average connectivity of 0.87 (Table 3), whereas with an average connectivity of only 0.02 (Table 4) it is Greater Dublin at the global scale that comes very close to pure primacy. Quite clearly these results show that polycentricity varies by the scale of links considered as well as across different regions. These differences in scale are shown in Table 5 in which the mega-city regions are ranked in terms of their polycentricity at the city-regional scale: RhineRuhr and The Randstad are the most polycentric and South East England (London) and the Rhine-Main Region (Frankfurt) are the most primate. What is interesting about this table is that this ranking is not invariant to scale: at the global scale, for instance South East England is the fourth most polycentric region. This means that while polycentricity declines as scale increases this does not happen to the same degree in every mega-city region. This effect can be measured by regressing scale (regional = 1, national = 2, European = 3, global = 4) against polycentricity: the gradient measures the degree of relative decline of connectivities by scale for each mega-city region. These results are shown in the final column of Table 5. The main finding of this part of the analysis is the way in which South East England and the Paris Region are quite different from the other six regions. With gradients of only -.0.065 and -0.073 respectively, these two mega-city regions are quite distinctive in the flatness of their gradients. Interpretation of this finding requires us to think of the mega-city regions, like cities, as process. In the cases of the other six regions, polycentricity falls appreciably with scale indicating that the leading city becomes more dominant – firms with worldwide office networks will tend to congregate in the leading city. This is particularly the case for Dublin where it has almost all the global connections of its region (i.e. the near pure primacy referred to earlier). But in the two regions centred on London and Paris a rather different process appears to be happening. Here the minor cities are attracting firms with wider office networks including at the global scale. These appear to be examples of the sort of city-region expansion that Jacobs (1984) has described but at a somewhat larger mega-regional scale. In other words the vibrant growth processes operating in London and Paris in contemporary globalization are diffusing out to other smaller cities in their respective regions. Thus these other cities are attracting business service firms with worldwide office networks resulting in the relatively high mean connectivities for the global scale relative to the regional scale in Table 5. This finding of two different mega-city regional processes operating in North West Europe will have important implications for spatial planning policy. As such this POLYNET research stimulated a follow up study at just the national scale to seek out the two processes within the UK space-economy. Two Mega-City Processes in the UK Space-EconomyIn the previous UK case study cities were assessed for their connectivities separately. Here we change scale to search out mega city-regions in the UK; we will contrast a greater South East England region with a prospective mega-city regional development in the rest of the UK. From the POLYNET project we understand that the London mega-city region will exhibit a Jacobs regional growth pattern; we expect mega-city region processes to be quite different outside this region. In this national scale only study, 158 firms from the eight sectors used in the POLYNET project with multiple locations in the UK were selected. These firms were found to have offices in 76 cities across the country. However 14 of these cities had just a single firm’s office and these were dropped from the study leaving 62 cities. Firms’ presences in cities were scored 0 to 3 as in the POLYNET project to produce a UK 158 firms x 62 cities service values matrix. (for further details see Taylor et al. (2007)). In the connectivity analysis, London came top as expected but at this national level it is less dominant among UK cities than at the global level as POLYNET results predict: Ca for Manchester, ranked second, is a relatively high 0.71. The next 11 cities are a ranking list of the UK’s leading provincial cities: Birmingham, Leeds, Bristol, Glasgow, Edinburgh, Cardiff, Newcastle, Belfast, Liverpool, and Nottingham with no particular surprises. But then it is all change. In Table 5 the middle ranking cities are shown and here we find a UK urban revolution. In the next 28 ranked cities all but seven are from the greater South East region. For the locational strategies of advanced producer service firms in the UK, traditionally important provincial cities are losing out to smaller urban places around London. This is perhaps epitomised at either end of this table with Milton Keynes being more connected than Sheffield and Basingstoke being more connected than Derby. But at least Sheffield and Derby are in the list; some important provincial cities are missing completely. For this data set, Blackburn, Bradford, Coventry, Middlesbrough and Sunderland record no connectivity in business services within the UK. This contrast between greater South East and the rest of the country can be interpreted as two distinctive mega-city processes consequent upon economic globalization. This study confirms the POLYNET finding of a classic city-region formation as famously described by Jacobs (1984) and adds much more detail to the process. Jacobs used the remarkable creation of a large Tokyo city region in the third quarter of the twentieth century to illustrate her argument (Jacobs, 1984: 47-55). It is contended here that London under conditions of contemporary globalization – Sassen’s (1991/2001) archetypal ‘global city’ – is experiencing a process similar to that described for Tokyo’s earlier expansion. We will term this Type A polycentricity: a mega-city regional process. London has long had a city-region (the Home Counties) but today’s mega-city regional process is at an altogether new scale of activity. The economic expansion is represented here by the growth of advanced producer services both within London itself and beyond creating a new larger city-region. This is what Table 6 indicates. It can be further investigated by concentrating on just London links (i.e. using equation (3) above). Table 7 shows 28 cities that have one tenth or more of their UK network connectivity with London. These cities can be divided into three categories. First, the greater South East that clearly extends far beyond the Home Counties to cities like Bournemouth, Peterborough, Oxford, Swindon, Cirencester, Chelmsford, and Cambridge. Second, there are the leading provincial UK cities for which, clearly, the London link is essentially part of their contemporary economic success: Manchester, Birmingham, Leeds, Bristol, Edinburgh and Cardiff are strongly linked to London. Third, there are three minor provincial urban places: Solihull, York and Chester. These are particularly interesting in suggesting the economic power of London is moving beyond the south; in the case of Solihull right up to the edge of Birmingham. In English national imagery, York and Chester are not typically ‘northern cities’, they are part of what has been termed the ‘real (English) north’, that is to say, the leading pre-industrial northern cities (Taylor, 2001b: 137). These appear to be being privileged over traditional industrial cities. In summary: Type A polycentricity as mega-city regional process is new to London in two ways. First, as just shown, it reaches far beyond the traditional London city region and clearly bursts out of the South East standard region, even the phrase ‘greater South East’ appears inadequate to describe London’s spatial imprint as a ‘global city’ within the UK. Second, it has encompassed several large cities that are themselves becoming important advanced producer service centres: Reading, Southampton, Cambridge and Milton Keynes are beginning to rival some leading provincial cities in terms business service links. In other words, the current economic expansion of London is creating a very large polycentric mega-city region in contrast to its history of regional primacy. The situation in the rest of the country is very different both historically and today. The leading provinicial cities have traditionally been part of polycentric industrial regions not unlike RhineRuhr. However, clusters of cities developed in the northern British industrial revolution have since declined through most of the twentieth century and there has been little concern to see them as polycentric city regions until recently. In fact, it is not the distinctive industrial regions (Lancashire cotton textile region, West Yorkshire woollen textile region, etc.) that are the current focus but their combination as a ‘Northern Way’ for balancing the economic power of London (Taylor et al., 2007). But this ‘balancing’ is through a rather different process than that just described for the greater South East. This is Type B polycentricity, a multi-city regional process in which leading cities prosper but there is little or no diffusion of growth to neighbouring cities. This is the message our connectivity analyses: Newcastle is doing well but not Sunderland, Leeds is doing well but not Bradford, Manchester is doing well but not Blackburn; Birmingham is doing well but not Coventry. It seems that business service firms are concentrating their offices on selected leading provincial cities leaving the rest dependent on just a few major ‘regional capitals’. Thus this is still a polycentric pattern but unlike the greater South East there is just a single layer of service centres with little or nothing below. In summary, Type B polycentricity, the multi-city regional process constitutes multiple concentrations of business service provision but there is no spreading of the service expansion, even to large cities, in comparison to London where even relatively small towns appear in the UK office networks of business service firms. Rather, outside the greater South East, the Type B process bypasses many previously important cities and is largely about enhancing the service capacities of selected larger cities. This GaWC research on mega-city regions is clearly relevant for state-level spatial planning, which will be addressed in the concluding comment. But before then we can briefly review a case study of national spatial planning from a city network perspective. There is no single document that describes spatial planning in the UK, hence we move to Poland for the final case study where national planning and its spatial requirements have recently been clearly spelt out (Taylor, 2007b). A CASE STUDY IN SPATIAL PLANNING: POLAND’S NATIONAL DEVELOPMENT POLICYThe official Polish document National Development Strategy 2007-2015 (NDS) (Ministry of Regional Development 2006) defines itself as ‘the principal strategic document defining the goals and priorities of Poland’s social and economic development and the conditions that should ensure this development’ (p. 7). Social and economic development is a very broad subject and the focus here is on the spatial planning components of the development strategy that are seen by the writers of the document to be a key element of the strategy. As a state document we expect discussion of these topics to be overtly territorial – a space of places approach – which we will engage with from a spaces of flows approach. Regional Development and Territorial CohesionIt is perhaps instructive that cities (or metropolitan areas) do not warrant a mention in the official vision of what Poland wants to be by 2015 (“III: Vision of Poland until 2015”, pp. 25-8). The only spatial references are to ‘a country being organized spatially’ (p. 27) and ‘territorial cohesion’ (p. 28). Clearly, and perhaps ominously, there is no vision of a successful Poland as a territorial constellation of vibrant and dynamic cities strongly integrated into a world city network. The vision is converted into ‘the main goal of the strategy’ of raising the quality of Polish lives (p. 29) that is to be realised by policy promoting ‘fast, constant economic growth’ (p. 29). The latter is described in terms of ‘development of human capital, increasing innovativeness in the sphere of research and development’ (p. 29), all features that require vibrant networked cities for their generation but again cities are conspicuous by their absence in this discussion. However, to plot the path towards this main goal, six priorities are identified as ‘the most important directions and main actions’ (p. 30). Two points immediately come to mind on considering these directions and actions. First, the spatial priority is to be found at the bottom of the list; does this indicate a lack of importance? Possibly not because it actually gets most text: the chapter dedicated to this priory is the longest of any priority chapter. Second, key elements of what make spatial development crucial are separated out as separate priorities: competitiveness/innovativeness listed first, and employment quality listed third. These are quintessential city processes; does their separation from the spatial priority render the latter largely irrelevant to economic development? Probably not, since the chapters on the competition and education priorities do not mention cities at all; this provides an opening for the spatial priority to synthesise material from the other priorities. Let’s see the degree to which this happens. The regional development goals for Spatial Priority are listed in Table 8. These do not look very promising with just one goal announcing that metropolitan areas should be developed, like rural areas. But this listing hides more than it reveal. It is followed by this most pertinent statement:
This describes an ideal starting point for integrating spaces of flows into spatial planning to make it more dynamic. In the lists of the ‘basic directions of activities of the state’ that follow, both competitiveness and education priorities feature (as well as other priorities) and this leads on to a synthesis of policies tailored to the specificities on individual voivoidships. These policy vignettes for each of Poland’s 16 voivoidships are quite short (typically about 20 lines) but they all include a statement on the need for metropolitan development – see Table 9 . This is a classic space of places policy framework in that there is no notion of links between voivoidships or metropolitan areas. In the NDS Annex metropolitan areas are defined for Poland as a large city (or cities) that combined with its surrounding areas has a population of 500,000 people or more (p. 134). There are nine cities that qualify and they are emboldened in Table 9 . Since no voivoidship has more than one metropolitan area, it follows that seven of them have no metropolitan area. Table 9 indicates a policy of rectifying this, converting Polish economic space into the ‘territorial cohesion’ that is being sought. It is important to note that despite the demographic definition of metropolitan area, their roles are to be dynamic as the statements on Warsaw and Trojmiasto clearly show. In other words, the term metropolitan is used to mean city process as described at the beginning of this paper. But the ‘one metropolitan area per voivoidship’ approach makes the policy very territorial; it is a space of places policy that privileges seven urban places that are not currently metropolitan areas. The key issue not developed explicitly in these policy vignettes is the matter ‘threats’ from spaces of flows. For instance, out-migration, especially of graduates (p.57), is a space of flows that neutralises gains from improved education policies. Already the migration of health professions is a problem (p. 122), which means Polish cities are training doctors and nurses to provide medical services in richer non-Polish cities. This question of human capital is addressed only briefly where a ‘rational migration policy’ is described in less than a page (p. 57). This is largely about restrictions on foreigners working in Poland and as such seems to be distinctively unhelpful. Attracting foreigners produces cosmopolitan cities, which should be seen as positive (obviously not with contemporary high levels of unemployment but these levels ensure little attraction of foreigners). However, the positive element of migration is understood. As well as proposing policies for retaining skilled/professional labour (previously, low cost, high skilled labour had been seen as an attraction to foreign investment (p. 14)), out-migrants should be encouraged to return: ‘conditions will be created giving a possibility of using the knowledge and skills acquired abroad in the business activity in Poland’. This is classic space of flows thinking involving collaboration across cities, a process of integrating Polish cities into the world city network. Despite the lack of real integration of the spatial into the economic and social priorities of the main goal, NDS is a document that far transcends the problem of spatial planning as space of places policy with resultant little relevance in economic globalization. In NDS spatial planning is as much about process as place and realization of goals is most certainly expected to rely heavily on cities; in fact it will be largely realized through cities. But are the goals, especially spatial cohesion, relevant to the country’s development needs? Beyond Regional Cohesion: The Need to Rethink PolycentricityIn an initial discussion of ‘Polish specificity’, ‘polycentric spatial development’ of the country is seen as an asset. This is because the country is not dominated by one large city and there are ‘a number of other large metropolitan areas’ to provide ‘development opportunities’ (p. 15). Let us relate this polycentric thinking to our previous mega-city region studies, in particular Type A polycentricity - polycentric mega-city regional process, and Type 2 polycentricity - polycentric multi-city regional process. Since in NDS polycentricity is identified as a state-scale spatial property, at this large scale Type B processes are very likely; for instance, the three eastern voivoidships are seen as being in danger of being by-passed by metropolitan processes (p. 77). This is clearly a problem for NDS’s interpretation of the polycentricity as having positive implications for national territorial cohesion. However, in the NDS Annex there is reference to the first stages of Warsaw developing faster than other metropolitan areas (p. 133). While this would be counter to the territorial cohesion ideal, it might signify a move to Type A city polycentricity whereby surrounding towns and cities share in the growth. And since Warsaw is in the east of Poland, this is the process that, if it developed to approach London or Paris scales, it could economically stimulate the three eastern border voivoidships in the longer term. But beyond the territorial cohesion ideal there is a pressing need for economic growth. It is recognised that such ‘fast development’ occurs in ‘urban conurbations’ (p. 17) in voivoidships with the ‘best development perspectives’ (p. 18). These alternative positions on the role of cities in development – cohesion and growth - is understood to be a ‘basic development dilemma’:
This is an impeccable argument of a general dilemma in spatial planning but it remains mired in spaces of places thinking. Other ‘conditions and premises’ are recognised that are clearly about spaces of flows and are not linked to this dilemma. For instance, ‘high unemployment’ is seen as ‘the main problem’ and is linked to low level of ‘innovativeness’ (p. 17), which can both be seen as a failure of Poland’s cities to generate sufficient expansion as part of city networks. The result has been the huge increase in out-migration on entering the EU. But, again, this ‘draining of human capital’ (p. 20) should be interpreted as relatively stagnant Polish cities losing out to other more dynamic EU cities that are prospering from this fresh injection of young skilled workers. Without integrating spaces of flows thinking into spatial planning Polish workers will continue to develop cities outside Poland. Warsaw as the centre of a Type A polycentricity is one obvious way to bring new thinking into spatial planning and keep workers in the country. The goal of spatial cohesion is not intrinsically a problem, but it is lethal if it brings spaces of places to a ‘common lowest denominator position’ through lack of integrating spaces of flows. Is Warsaw up to the job? We can go back to the worldwide connectivity analyses discussed previously to provide some evidence to answer this question. In Table 10 Warsaw is compared to the three other main ex-COMECON capital cities for connectivities in 2000, 2004 and 2000-04 change. The results are very encouraging: Warsaw is faring well under conditions of contemporary globalization relative to the other cities and is clearly becoming an important world city. The findings show that major advanced producer service firms are using this city indicating both capacity to engage in global business and the existence of a developing vibrant city economy. These are presumably the hints that Warsaw is growing faster than other Polish cities in the NDS Annex noted previously. From a space of flows perspective this emerging position of Warsaw in the world city network should be nurtured and consolidated in any national spatial planning. Poland still needs a modern vision of itself as a land of vibrant, dynamic, creative cities. A simple measure of success in 2015 will be how cosmopolitan Polish cities are, especially Warsaw. CONCLUDING COMMENTThis chapter has attempted to introduce a space of flows way of thinking to an urban policy audience. The latter will inevitably be concerned for territories, their spatial authority and responsibility will be bounded, meaning that a space of places will be their standard way of thinking. My emphasis on an alternative form of social space should not be interpreted as suggesting space of places is not important for urban policy; that would be ridiculous. Rather, it is a plea to be prepared to think in new ways consequent upon contemporary globalization. I have concentrated the empirical sections on city network connectivities to provide some coherence to the text but the initial sections of the argument should have indicated that there are many issues beyond measuring inter-city relations. In any urban policy development the question of hierarchy or network must be clear along with the concomitant competition or cooperation. I will conclude with one feature of the approach developed above that will be a challenge for urban policy making but one it should be possible to address. A key part of the space of flows argument from Castells is to think in terms of processes rather than places. This translates on the ground, as were, to be able to transcend absolute bounded spaces with relational overlapping spaces. This is not to abandon places but rather to see them, as Doreen Massey (1997) does, as having no strict boundaries: places are made by the flows that go in, through and out of them: there is no contradiction between place and flow except for the need to make administration and government simple (Taylor 2007a). But cities are inherently complex; instead of debating city boundaries in regular administrative reviews, we should be thinking of how to transcend boundaries in a mark of respect for city complexity. Without such respect urban policy will tend towards being an obstacle to creating vibrancy in cities rather than a facilitating tool. Certainly mega city-regional processes cannot be sensible bounded and therefore urban policy reactions to globalization should not be simply the latest episode in extending city boundaries. REFERENCESBartlett, C. J. (1984) The Global Conflict, 1880-1970, London: Longman. Castells, M. (1996) The Rise of Network Society, Oxford: Blackwell. Cox, K. R. (1997) ‘Introduction: globalization and its politics in question’, in K. R. Cox (ed.) Spaces of Globalization, New York: Guilford Friedmann, J. (1986) ‘The world city hypothesis’, Development and Change’, 17, 69-83. Friedmann, J. (1996) ‘Where we stand: a decade of world city research’, in P. N. Knox and P. J. Taylor (eds.) World Cities in a World-System, Cambridge: Cambridge University Press, 21-47. Friedmann, J. and G. Wolff (1982) ‘World city formation:an agenda for re-search and action’, International Journal of Regional and Urban Research, 3, 309-44. Hall. P. (1966) The World Cities, London: Heinnemann. Hall. P. (1999) ‘Planning for the mega-city: a new eastern Asian urban form?’ in J. Brotchie, P. Newton, P. Hall, and J. Dickey (eds.) East-West Prespectivesin 21st Century Urban Development, Aldershot: Ashgate, 3-36. Hall, P. and K. Pain (2006) The Polycentric Metropolis. London: Earthscan. Held, D. A McGrew, D Goldblatt and J Perraton (1999) Global Transformations, Cambridge, UK: Polity. Hymer, S. (1972) ‘The multinational corporation and the law of uneven development’, in J. Bhagwati (ed.) Economics and the World Order from the 1970s to the 1990s, London: Collier-Macmillan, 257-89. Jacobs, J. (1969) The Economy of Cities, New York: Vintage. Jacobs, J. (1984) Cities and the Wealth of Nations, New Yotk: Vintage. Knight, R. V. and G. Gappert (eds) (1989) Cities in a Global Society, Newbury Park, CA: Sage. Knoke, D. and J. H. Kuklinski (1982) Network Analysis, Beverly Hills, CA: Sage. Lukermann, F. (1966) ‘Empirical expressions of nodality and hierarchy in a circulation manifold’, East Lakes Geographer, 2, 17-44. Marcuse. P. and R. van Kempen (eds.) (2000) Globalizing Cities, Oxford, Blackwell. Massey, D. (1997) ‘A global sense of place’, in T Barnes and D. Gregory (eds.) Reading Human Geography, London: Arnold, 315-23. Ministry of Economic Development (2006) National Development Strategy 2007-2015, Warsaw: Ministry of Regional Development. Reed, H. C. (1981) The Pre-eminence of International Financial Centers, New York: Praeger Sassen, S. (1991/2001) The Global City, Princeton, NJ: Princeton University Press (two editions). Sassen, S. (1994/2000/2004) Cities in a World Economy, Thousand Oaks, CA: Pine Forge (three editions). Scott, A. J. (ed.) (2001) Global City-Regions, Oxford: Oxford University Press. Short, J. R., Y. Kim, M. Kuss and H. Wells (1996) ‘The dirty little secret of world city research’, International Journal of Regional and Urban Research, 20, 697-717. Sklair, L. (2002) Globalization: Capitalism and its Alternatives, Oxford: Oxford University Press. Taylor, P. J. (1997) ‘Hierarchical tendencies amongst world cities; a global research proposal’’, Cities, 14, 323-32 Taylor, P. J. (2001a) ‘Specification of the world city network’ Geographical Analysis , 33, 181-94. Taylor, P. J. (2001b) ‘Which Britain? Which England? Which North?’ in D. Morley and K Robins (eds) British Cultural Studies, Oxford: Oxford University Press, 127-44. Taylor, P. J. (2004) World City Network: a Global Urban Analysis, London: Routledge. Taylor, P. J. (2007a) ‘Problematizing city/state relations: towards a geohistorical understanding of contemporary globalization” Transactions, Institute of British Geographers, NS32, 133-50. Taylor, P. J. (2007b) ‘Spatial planning and city networks in economic development: a friendly critique of the Polish National Development Strategy 2007-2015, GaWC Research Bulletin, No. 255 Taylor, P. J. and R. Aranya (2006) ‘Connectivity and city revival’, Town and Country Planning, Taylor, P. J. and R. Aranya (2008) ‘A Global “Urban Roller Coaster”? Connectivity Changes in the World City Network, 2000-04’ Regional Studies, Taylor, P. J., G. Catalano and D. R. F. Walker (2002) ‘Measurement of the world city network’, Urban Studies, 39, 2367-76. Taylor, P. J., B. Derudder, P. Saey and F. Witlox (eds.) (2006) Cities in Globalization, London: Routledge. Taylor, P. J., D. M. Evans, M. Hoyler, B. Derudder, and K Pain (2007) ‘The UK space economy as practised by advanced producer service firms: identifying two distinctive polycentric city-regional processes in contemporary Britain’, GaWC Research Bulletin No. 227. Taylor, P. J., D. M. Evans, and K. Pain (2006) ‘Organization of the polycentric metropolis: corporate structures and networks’, in P. Hall and K. Pain (eds.) The Polycentric Metropolis, London: Earthscan, 53-64 Taylor, P. J., D. M. Evans, and K. Pain (2008) ‘Application of the interlocking network model to mega-city regions: measuring polycentricity within and beyond city-regions.” Regional Studies, Taylor, P. J. and R. E. Lang (2004) “The Shock of the New: 100 concepts describing recent urban change” Environment and Planning A Taylor, P. J. and R. E. Lang (2005) US Cities in the World City Network, Washington DC: The Brookings Institution (Metropolitan Policy Program, Survey Series. Worsley, P. (1984) The Three Worlds, London: Weidenfeld and Nicholson. Figure 1: World city network: city connectivities in 2000
Source: Taylor (2004) Figure 2: World city network: changes in ranks among top 20 cities, 2000-2004
Source: Taylor and Aranya (2008) Figure 3: World city network: city connectivities in 2004
Source: Taylor and Aranya (2008) Figure 4: UK cities: World city network connectivity rankings, 2000 and 2004
Source: Taylor and Aranya (2006)
Table 1 Fifty descriptions of inter-city relations under conditions of contemporary globalization
Source: Taylor and Lang (2004) where references to each concept are given.
Table 2 UK Cities: World City Network Connectivity Change 2000-04
Source: Taylor and Aranya (2006).
Table 3 North West Europe: City Network Connectivities and Polycentricity at the city-regional scale
Note: Polycentricity is measured by the average % of the 5 non-leading cities, see Table 1 (b). Source: derived from Taylor, Evans and Pain (2008).
Table 4 North West Europe: City Network Connectivities and Polycentricity at the city-regional scale
Note: Polycentricity is measured by the average % of the 5 non-leading cities, see Table 1 (b). Source: derived from Taylor, Evans and Pain (2008).
Table 5 North West Europe: Polycentricity for Different Geographical Scales by Mega City-Region
Notes: The Belgium national scale was conflated with the Brussels regional scale Source: adapted from Taylor, Evans and Pain (2008) Table 6 Middle ranking UK cities by connectivity
Source: derived from Taylor et al. (2007).
Table 7 Places with relatively large links with London
Source: derived from Taylor et al. (2007).
Table 8 Polish National Plan: Regional development goals in Priority 6
Source: Taylor (2007), derived from Ministry of Regional Development (2006), p. 73
Table 9 Polish National Plan: Metropolitan statements in the Regional Development and Territorial Cohesion Priority
All quotes are from Priority 6 in Ministry of Regional Development (2006), pp 78-83 Source: derived from Taylor et al. (2007).
Table 10: Warsaw in the world city network, 2000-2004
Source: derived from Taylor et al. (2007).
Note: This Research Bulletin has been published in H.S. Geyer (ed) (2009) International Handbook of Urban Policy, Volume 2: Issues in the Developed World, Cheltenham, UK, Edward Elgar, pp. 74-102. |
||||||||||||||||||||||||||||||||||||||||||||||||||||||||||||||||||||||||||||||||||||||||||||||||||||||||||||||||||||||||||||||||||||||||||||||||||||||||||||||||||||||||||||||||||||||||||||||||||||||||||||||||||||||||||||||||||||||||||||||||||||||||||||||||||||||||||||||||||||||||||||||||||||||||||||||||||||||||||||||||||||||||||||||||||||||||||||||||||||||||||||||||||||||||||||||||||||||||||||||||||||||||||||||||||||||||||||||||||||||||||||||||||||||||||||||||||||||||||||||||||||||||||||||||||||||||||||||||||||||||||||||||||||||||||||||||||||||||||||||||||||||||||||||||||||||||||||||||||||||||||||||||||||||||||||||||||||||||||