
GaWC Research Bulletin 243 |
|
|
|
This Research Bulletin has been published in Urban Studies, OnlineFirst, (2010). Please refer to the published version when quoting the paper.
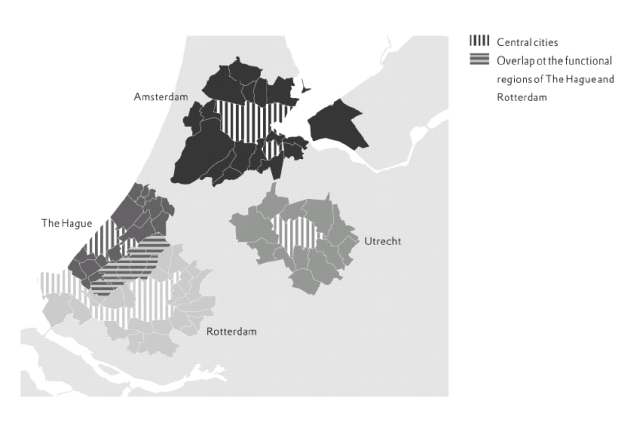
IntroductionFrom a geographical point of view, the Randstad is known as the urban conurbation in the western part of the Netherlands, in which four major cities (Amsterdam, Rotterdam, The Hague, and Utrecht) and a number of smaller towns are located within close proximity of each other (see Figure 1). The Randstad constitutes the heart of the Dutch economy, with 50% of the gross national product being generated on approximately 25% of the country’s total land area. Having a population of six million inhabitants, the Randstad houses over one third of the Dutch population. However, in the debate on spatial planning and economic policy in the Netherlands, the ‘Randstad’ stands for more. The name, since it includes the Dutch word for ‘city’ (‘stad’, in the singular), suggests that the Randstad is a single, contiguous urban region. Suggestions that the region functions as an integrated economic entity for basic industries, like manufacturing activities, distribution activities and business services, are numerous (see e.g., Dieleman and Musterd, 1992; Sachar, 1994; Batten, 1995; Kloosterman and Lambregts, 2001; Lambregts, 2008). Based on these suggestions, policymakers now more than ever aim at the concentrated location of (inter)national firms and businesses in this networked region in order to have optimal economic growth potentials (VROM 2008). Nevertheless, simply assigning a name, such as the Randstad, to a collection of towns and cities does not automatically meld them into a spatial and functional integrated city with economic complementarities and firms benefiting from region-wide agglomeration economies. Figure 1 The Randstad research area and the 67 municipalities in the survey
From the 1960s onwards, the Randstad has been regarded internationally as one of the most important urban networks or functional clusters of economic activity in Europe (Hall, 1966; Batten, 1995). It is argued that the Randstad functions as a role model for a network of cities and towns, which, given their mutually dependent specialisations and their variety, creates a favourable setting for economic production and growth (Lambregts et al., 2006). In the urban geography and planning literature, it is generally contended that such cities and towns complement each other in terms of economic specialisations, each being therefore more competitive than they would be in isolation (Meijers, 2005). This representation of the Randstad as urban network is based on the assumption of a considerable regional cohesion in personal, occupational and corporate relationships of people, organisations and firms that transcends the boundaries of the traditional metropolitan areas. The general contention for different cities within an urban network to be complementary to each other requires that the cities not only be specialised in different industries but at the same time also be showing a marked degree of spatial interaction and hence integration. In this, inter-firm relationships are considered to be most fundamental to the creation and evolution of such an urban network (Sachar, 1994; Lambooy, 1998). Camagni and Capello (2004, p.496) argue that polycentric urban regions comprise a new paradigm in spatial sciences, provided that (a) the exact meaning is defined, (b) the theoretical economic rationale is justified, and (c) the novel features of its empirical content are clearly identified and distinguished from more traditional spatial facts and processes that can be interpreted through existing spatial paradigms. Camagni and Capello (2004, p.496) further argue that “the concept of spatial networks is sometimes merely used as a substitute for ‘interaction’: an exchange of goods, services, information and contacts among places and nodes. Traditional paradigms of spatial interaction can be easily utilised, unless one could demonstrate that the probability of such exchanges is mainly independent of distance and the size of nodes”. This paper contributes to the discussion on economic complementarities in urban networks by analysing networked economic relations in the Randstad. To date, there has been little empirical research into the spatial and functional economic cohesion of urban-networked regions, mainly because of a lack of inter-firm relational data. We use a recently-collected dataset that stems from a large-scale survey of 1676 firm establishments that are active in the sectors industry, producer services and distribution in the Randstad to test for the presence of urban complementarities. A detailed insight into inter-firm networks is obtained by asking these firms to identify their most important business relationships with customers and suppliers in terms of physical goods, services and information. Using these data, which are representative of the entire commercial sector in the Randstad, and defining urban complementarities by the combination of spatial and functional integration between localised specialised firms, we answer three related questions on the economic foundation of urban networks:
The rest of this article is organised as follows: Section 2 discusses the literature on the spatial and functional development of cities and urban systems, focusing primarily on the role of economic networks in the concepts of spatial integration, functional integration and economic complementarities. Section 3 offers a diagrammatic representation of the network relationships of the surveyed firms. Section 4 examines the degree of spatial integration of inter-firm relationships in the Randstad by means of spatial interaction models. In Section 5, we inspect the degree of functional integration by looking at the degrees of specialisation and diversification across municipalities in the Randstad in relation to the interactions between firms in these municipalities. Finally, in Section 6, we examine the presence of urban complementarities in the Randstad, conclude on our three research questions and sketch out policy implications. The Economic Foundation of Changing Urban SystemsThe Monocentric Model: Towns into Cities and Daily Urban SystemsIn order to judge whether the Randstad can be classified as a single urban economic entity, a classification of urban functions in relation to the morphology of cities is necessary. Prior to the Industrial Revolution, a city could be identified as a monocentric agglomeration of people and businesses (a town), clearly separated from the countryside. What made cities most distinctive from the rural areas was their specific legal status (notably ‘city rights’) and their political identity. Markets and administrative places gradually “ crystallized as central places for their surrounding areas in which each center approximated the center of gravity of its service area in order to minimize transportation costs” (Hohenberg and Lees, 1985: 49). From a morphological point of view, the city in the pre-industrial era was then also very concentrated and centralised, as physical distance often encumbered interactions between different areas. As a result, business relations were often restricted to the urban core. Cities shifted their borders when mobility steadily increased and communication technology further developed. The tram, train, and telegraph in the nineteenth century and the telephone and the automobilesation in the twentieth century are examples of technology that impacted urban development (Anas et al., 1998). Also, due to the existence of cheaper land outside the urban centre and rising welfare levels, households increasingly choose to locate further away from the city centre (Pred, 1973). These developments led to the rise of metropolitan areas or Daily Urban Systems (DUS), which are typically defined by the most important commuting relations (Van der Laan, 1998). The relationship between the urban core and its suburbs remained hierarchical-nodal. Most economic activity was based in the urban core, commuting flows were directed towards the central cities, and suburbs only fulfilled a residential function. Here, the metropolitan region is characterised as a central place system with the central city as main focus. In line with this well-defined morphological and functional development of cities, the traditional starting point for a treatment of the theory on urban systems then was Burgess’ concept of the monocentric city (Burgess, 1925), later formalised in a location and land use theory by Alonso (1964). The concept of the monocentric city involves a central business district, surrounded by a circular residential area whereby land is allocated according to its most profitable use. The general idea of the monocentric city is that most economic activities are based in the urban core, whereas suburbs fulfil a residential function. Hence, the relationship between the urban core and its suburbs in the monocentric model is hierarchical-nodal or centralised in the sense that commuting flows are predominantly directed from the suburban areas towards the central cities. The monocentric theory of urban development further suggested that inter-firm business flows largely remain within or between urban cores (Pred, 1973, 1977), although space-consuming economic activities – like industrial and distribution activities - are hypothesised to radiantly develop out of the city centre (Smith, 1971; Phelps and Ozawa, 2003). From a morphological point of view, this radiation of population and employment, causing the transformation of towns into cities into regionalised daily urban systems, is characterised as a shift in intra-urban scale (Kloosterman and Musterd, 2001) The Polycentric Urban Region (PUR)The focus of the contemporary debate on changing urban systems has increasingly shifted from the intra-urban scale to the inter-urban scale (Kloosterman and Musterd, 2001; Hall and Pain, 2006; Hoyler et al., 2008; Bailey and Turok, 2001; Coe and Towsend, 1998). The inter-urban scale corresponds to flows between different urban regions. Usually, urban systems are blended in terms of intra- and inter-urban relations, in which intra-urban relations refer to relations in which the ‘own’ core and periphery districts are involved, and inter-urban relations refer to relations between core and peripheral districts in different urban regions. As catchment areas of different cities start to overlap, individual metropolitan areas lose significance as independently functioning daily urban systems and could instead be perceived as forming parts of an urban network. Much of the current literature is focused on this development -that is, the development of the Polycentric Urban Region (PUR). The PUR can be represented as an urban network of historically and spatially separate metropolitan areas comprising a larger region (Bourne and Simmons, 1978; Meijers, 2007). These metropolitan areas can be network-cities themselves, but this is not necessarily the case (i.e., the Urban System can be dominated by a polycentric structure at the inter-urban level and a monocentric structure at the intra-urban level or vice versa). Likewise, urban network formation on the inter-urban level is not necessarily the next evolutionary step after the (intra-urban) network-city (Parr, 2004, Graham and Marvin 2001). Social and economic processes are taking place on an ever-larger geographical scale, in which suburban areas increasingly emerge into local centres that develop their own economic activities and because of this start competing with the original urban core (Garreau, 1988). The result is the development of cities with multiple centres, or polycentric cities. In such a polycentric city, commuting is no longer centralised but is instead reciprocal in the sense that flows are directed n ot only from the suburbs to the urban core but also from the urban core to the suburbs. The spatial range of functional relations corresponds to commuting and firm-relational flows that remain within the urban region. Flows of goods, services and people become decentralised as the number of workers commuting between suburbs and bypassing the old urban core increases (crisscross relations). More specifically, economic complementarities within the daily urban system (DUS) arise, where one location may be regarded as ‘central’ in terms of one particular function while other places might be central in terms of other functions. This conceptually coincides with the identification of the paradigm shift suggested by Camagni and Capello (2004): from a central-place model to an urban network model. The former is characterised by periphery-core relations (for commuting, shopping and lower-order inter-firm relations) and inter-core relations (for higher-order inter-firm relations), while significant core-periphery, crisscross and intra-urban inter-firm relations should characterise the latter. The Economic Foundations of Urban NetworksThe conceptualisation of urban network formation is predominantly tested by interaction patterns of people. Previous research has focused on the effect of the increasing flexibility and mobility of people and their changing residential preferences on the urban system (Renkow and Hoover, 2000; Van Ham, 2002). To some extent, these residential preferences are mutually influenced by enhanced mobility, the increasingly flexible workplace and choices of lifestyle and attitudes of households, including the locational preferences of two-earner households, the increasing number of working women, and an increasing number of single-person households (Hall, 2001). Still, these trends in labour supply do not, on average, coincide with a larger labour mobility of employees: the average commuting time in the Netherlands has remained stable over the last 20 years at approximately 25 minutes (Van der Burg and Dieleman, 2004). Only a limited number of higher-educated professionals have become more mobile over time.1 Instead, firms are argued to have become the most mobile and flexible over the recent years. This would implicate that urban networks form an enlarged home base for firms in terms of market potential, diversity and quality of available knowledge, infrastructure, institutions and subcontracting possibilities (Pred, 1977). This microeconomic (business) foundation of urban networks is hinted at in the literature (Kloosterman et al. 2001; Lambregts et al., 2006), but that has not been researched much in the urban geography and planning literature. This is not surprising, since urban economists have for some time fuelled a burgeoning empirical literature that examines whether spatial circumstances give rise to agglomeration economies – external economies from which firms can benefit through co-location and local network creation – that endogenously induce localised economic growth (Glaeser et al., 1992; Combes, 2000; Rosenthal and Strange, 2003). In their survey of the empirical literature on the benefits of agglomeration, Rosenthal and Strange (2004) point out that the elasticity of productivity to city and industry size typically ranges between 3% and 8%. However, the effects of agglomeration economies on localised economic growth differ across sectors, time and space (Rosenthal and Strange, 2004; Van Oort, 2007). Concerning the latter, there is a growing interest in this debate on agglomeration economies in the networked structure of (systems of) cities (Anas et al., 1989; Hall and Pain, 2006). At the micro level, the relation between the morphology of cities or city-systems and economic performance is conceptualised by the increasing flexibility and mobility of firms. The hypothesis is that trends in urban system dynamics are driven by changes in the spatial distribution of employment and growth opportunities (Renkow and Hoover, 2000). Aoyama and Castells (2002) argue that these changes are facilitated by key advancements in transport technology and in information and communication technology (ICT), by globalisation and flexible specialisation in production and by the economic change of most western economies from a production to a services-dominated economy. There is considerable academic debate on the precise spatial and economic effects of these developments. Concerning ICT, for instance, in one view – the substitution view – it potentially influences the production of new products and the location of their production by substituting for production factors such as manual labour or traditional means of transport. This then leads to higher efficiency and productivity in firms. In substituting physical transport by ICT – mainly relevant for services – a reduction in time and transaction costs can be achieved. A liberalising or centrifugal effect then occurs, in the literature summarised as the ‘death of distance’ or the ‘weightless economy’, in which economic value is transmitted across physical space at zero marginal costs (Horan et al, 1996; Kolko, 2002). The so-called complementary view on the other hand stresses inertial and concentrated growth patterns. In this conceptualisation, spatial economic dynamics occur within the limits of the spatial interaction patterns laid down in the past in processes characterised by cumulative causation. Moreover, firms are also physically constrained by the necessity of face-to-face contact (Geyer, 2002). Functional and trust relations thus limit the morphological layout of urban agglomeration to that of the (polycentric) region (Nooteboom, 1999). Comparable discussions concern the (spatial) flexibility thesis of firms. It is argued that to compete in the network economy, firms have to make production processes more flexible with respect to time, place, contracts and job content (Scott, 1988). Increasing uncertainty in markets and differentiation in consumer demand in terms of varieties, brands and quality force firms to run small-scale production batches. The outsourcing of economic activities that do not directly belong to the core activities of the company is stimulated, and vertical cooperation with firms active within the same industry becomes more important. This flexibilisation of business processes and the functional division of tasks between companies create opportunities for a spatial division of labour, and different spatial settings or locations become suitable for different economic functions. The result is often argued to be a polycentral and multi-nodal structure, in which flows of goods, services and people are not one-sided, but two-sided and crisscrossed (Curran and Blackburn, 1994). Integration and Complementarities in Local and Regional PolicyLocal and regional policies often have the explicit intention of economic deconcentration and urban network formation. A well-known example of an intentional policy towards economic deconcentration is the ‘growth pole concept’ (Parr, 1999). The aim of this policy is to create economic development in peripheral areas by encouraging the establishment of industrial growth centres in the periphery. Ultimately, this should have led to the development of the hinterlands of these growth centres, in turn spreading the benefits of economic development over a larger area. Similarly, by embracing the urban network concept, national as well as local policymakers and urban planners attempt to actively develop suburban and adjacent areas, with the objective of spreading economic prosperity and enhancing territorial competitiveness of urban regions (Glaeser, 2007). Also in the Netherlands , the urban network paradigm is embraced by policy in this vein. In recent policy memoranda by the Ministry of Economic Affairs (Peaks in the Delta 2005), the Ministry of Housing, Spatial Planning and the Environment (Spatial Memorandum 2004 and Structural Vision Randstad 2040), and the Ministry of Transport (Mobility Memorandum 2004), the concept takes in a prominent place. Three key concepts within the present-day academic as well as policy conceptualisation of urban networks are spatial integration, functional integration and urban complementarities. Spatial i ntegration between the towns in an urban network (for instance in the Randstad) results from the improved opportunities for mobility and communication, which facilitate larger transport and information flows and stronger relationships between the individual urban agglomerations. An urban network can be classified as a functionally integrated entity if alongside more spatial integration there is differentiation between the municipalities in terms of urban economic functions. In an economic sense, this would require that the municipalities that make up an urban network (the Randstad) be specialised in different economic sectors, hereby fulfilling different economic roles (Meijers, 2005) . For example, a city specialised in business services provides these services to a city specialised in labour-intensive industry, and vice versa (Lambregts et al., 2006). In sum, differences in relative specialisations (functional integration) together with a large degree of interaction between economic agents (spatial integration) economically define an urban network that is characterised by economic complementarities. In earlier days, integration and complementarities bundled in one town or city, but with the increasing flexibility and mobility of firms, their goods and services and the division of labor, it is suggested that these processes are now embedded in regionally-defined networks. Despite the fact that both the academic literature as well as policy documents on urban networks use the concepts of spatial and functional integration and economic complementarities, only few empirical studies have qualitatively assessed how well the network model fits the reality of contemporary urban systems (Davoudi, 2003; Capello, 2000). Unfortunately, most of the available empirical evidence is based on node characteristics, by which (inter-firm) interaction patterns can be mainly explained by distance and the size of nodes, using methods such as location quotients, rank-size relations, sufficiency indices, and employment-to-work ratios (Limtanakool et al., 2007; Camagni and Capello, 2004). In our empirical analysis, we will introduce a method based on flow characteristics that tests for the spatial structure of inter-firm relations independently of masses of nodes and the distances between them. Inter-firm Relations in the RandstadData: A Survey among Firms in the RandstadIn the previous section, we de fined urban complementarities as the combination of spatial integration and functional integration. To test whether the Randstad does indeed function as such a single economic system or urban network with complementary sub-economies, we have examined the spatial dynamics of firms’ networks within the region. The network relationships involve (sub)contracting, purchasing and selling of products, services and knowledge. In our analyses, we aggregate the relationship flows into municipalities (LAU-2) of which there are 69 in the Randstad, see Figure 1). The survey was conducted in 2005 among more than 20,000 selected firms (establishments) with more than one employee and based in the Dutch Randstad (divided in four sub regions, see figure 1). A random stratified sample, taking size, sector and regions into account, was taken from the LISA database (an employment register of all Dutch economic establishments, see Van Oort, 2007). For this research, we included firms in manufacturing, wholesale and business services. These basic sectors are not directly bound to consumers for their location as retail is, for example. The response of 1676 establishments - approximately 8% - is representative of the stratification by region, size and sector. The questionnaire focuses on the sources and destinations of an individual firm’s ten most important selling and purchasing relations, which we aggregate to the municipality level in our analysis. Table 1 shows for each of the four sub-regions in the Randstad ( Amsterdam, Rotterdam, The Hague and Utrecht) the firm population, the firm sample size, and the number of firms responding to the questionnaire. The calculation of the sample size is based on stratification by region, economic activities (by sector, 27 NACE codes in manufacturing, wholesale and business services) and firm size (6 size classes). Table 1: Number of establishments by region and sector
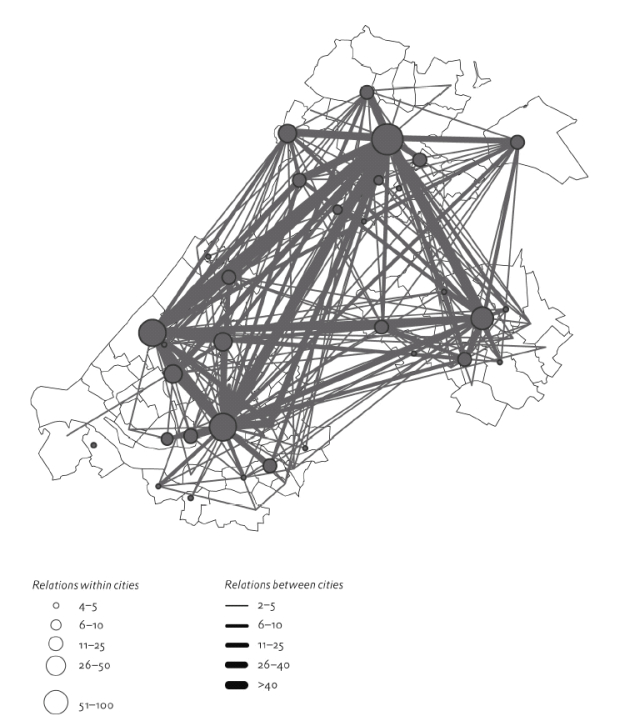
Visualisation of Network Patterns within the RandstadFigure 2 shows the network of inter-firm relationships for the entire Randstad. In this figure, the respondent population is not classified by sector or size. The dots indicate the extent of relationships within an individual town or city, e.g., companies in The Hague that maintain a business relationship with other companies in The Hague. The lines represent the relationships between companies in different towns or cities. A large number of relationships can be seen within the four major cities, but there are also flows between these main centres. Moreover, a significant number of crisscrossing relationships, i.e., relationships between companies that are located outside the central cities, can be noticed. In absolute terms, the four major cities function as the centres of the urban network. Not only do companies there maintain the largest number of relationships with other firms in the same municipality, but they also are involved in a large number of flows within the larger network. This is particularly true in the case of Amsterdam, which occupies a key position in the Randstad’s overall network. It should be noted, however, that Figure 2 is only telling half of the story: about 50% of all inter-firm relationships of firms that are located in the Randstad region transcend the boundaries of the Randstad. Figure 2: The network of inter-firm relationships in the Randstad
Figure 2 gives a descriptive account of the embeddedness of economic networks in the Randstad region. However, an obvious criticism of such a visual analysis is that it does not allow for differences in the absolute sizes of municipalities (in terms of firm population) and the physical distances between them. For example, recent empirical studies conducted within the POLYNET research framework (e.g., Green, 2007; Hall and Pain, 2006) do not address this issue. The likelihood of an inter-firm relation with companies located in a large city with many (and a sectorally varied number of) firms is larger than one directed to a smaller city with fewer firms. Likewise, the likelihood of an inter-firm relation between two cities in close proximity to each other is larger than the likelihood of one between municipalities located far from each other. F igure 3 therefore shows the same map as figure 2, but the visualized spatial interactions are now characterized by their deviation from the number of expected relationships based on the size of the originating and destination municipalities and their mutual physical proximity. In order to compare the observed versus the expected interaction intensity between cities in the Randstad region, we made use of the likelihood ratio chi-square statistic (Agresti 2002). Where the number of actual relationships is significantly larger than the expected figure, this is shown in dark gray shading. Where the number of actual relationships is significantly smaller than the expected figure, this is shown in light gray shading. Non-significant relations are shown in black. Figure 3 shows that inter-firm relationships within the same municipality and relationships between central cities and their direct (adjacent) hinterland are in general larger in number than projected. Inter-firm relations between the four central cities are less than expected. All locations and regions in the modern economy interact to some extent (Fingleton, 2003). Accordingly, based on Figure 2 we cannot draw conclusions on the nature of the existing urban interdependencies within the Randstad region. And although figure 3 suggests a spatial hierarchy in more-than-expected interactions, it is not precise in the degree of this ranking and does not inform us on functional interactions. We therefore introduce an interaction model that controls for masses of cities and their mutual physical proximity to analyse spatial and functional integration more accurately. The Spatial Economic Integration of the RandstadModelling Spatial IntegrationIn this section, we test whether the municipalities in the Randstad form a spatially integrated urban system based on inter-firm relations. In this, we use a rather strict testing system in the sense that we speak of spatial integration when there is no effect of spatial-functional context on inter-firm network intensities other than the economic mass of sending and receiving localities and the physical distance between them. If the Randstad functions as a spatially integrated urban system (from an economic point of view), the spatial network structure of inter-firm relations in the Randstad is solely determined by these two variables. Three related conditions for spatial integration are, therefore:
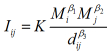
We test these conditions within the context of a gravity model. Spatial interaction patterns, such as inter-firm flows, can be predicted and elucidated in analogy with Newton’s law of universal gravitation (Haynes and Forthingham, 1985; Sen and Smith, 1995). The gravity model assumes that the gravitational force between two objects (in our study, the interaction between companies, aggregated at the level of the municipality) is dependent on the mass of the objects and the physical distance between them. More specifically, the interaction intensity between two municipalities (the origination and destination) is hypothesised to be directly correlated with the masses of the municipalities and inversely correlated with the physical distance between the two municipalities. More formally,
where Iij is the gravitational force, or in our case the interaction intensity between municipality i and j expressed by the number of linkages, K a proportionality constant, Mi the mass of the municipality of origin, Mi the mass of the municipality of destination and dij the physical distance between the two municipalities. β1, β2, and β3 are parameters to be estimated. Here, the mass of the municipality of destination and origin are defined as the total number of inter-firm relations of each municipality, as embedded in the network. As inter-firm relationships are considered to be undirected in this study, there is no clear distinction between the municipality of origin and the municipality of destination. Hence, the natural logarithm of the product of Mi and Mj is taken together as one variable in our analysis. Distance is measured as the crow flies between cities, where intra-municipal distances are calculated by (2):
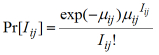
in which the intra-municipal distance dii is two thirds of the radius of the presumed circular area Ai (see Bröcker (1989) and Frost and Spence (1995) for the exact derivation and overview of considerations of this). Spatial interaction data should be handled as count data, as they ‘count’ the number of times that something has happened, which in our case is the frequency of flow (expressed as interaction intensity) between and within municipalities. Although these data are often treated as though they are continuous, the application of the conventional linear regression model here can lead to inefficient, inconsistent, and biased estimates (Flowerdew and Aitkin, 1982; Long, 1997) as the underlying assumptions of normal distribution and homoskedasticity are often not satisfied. For this reason, the use of alternative regression techniques is more appropriate. The most common regression model applied to count data is probably the Poisson regression, which is estimated by means of maximum likelihood estimation techniques. In this log-linear model, the observed interaction intensity between municipality i and j has a Poisson distribution with a conditional mean (μ) that is a function of the independent variables (3). More specifically,
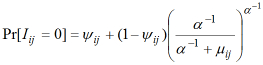
, where In order to correct for overdispersion (where conditional variance is larger than the conditional mean) and an excessive number of zero counts in our data set (where the incidence of zero counts is greater than would be expected for the Poisson or negative binomial distribution), we make use of the zero-inflated negative binomial regression, which can be perceived as an extension of the Poisson model. Not correcting for the overdispersion and excess zero problem normally results in consistent but inefficient estimates, exemplified by spuriously large z-values and spuriously small p-values due to downward biased standard errors (Gourieroux et al., 1984; Cameron and Trivedi, 1986). The zero-inflated negative binomial model considers the existence of two (latent) groups within the population: a group having strictly zero counts and a group having a non-zero probability of counts different than zero. Correspondingly, its estimation process consists of two parts (4.1 and 4.2).
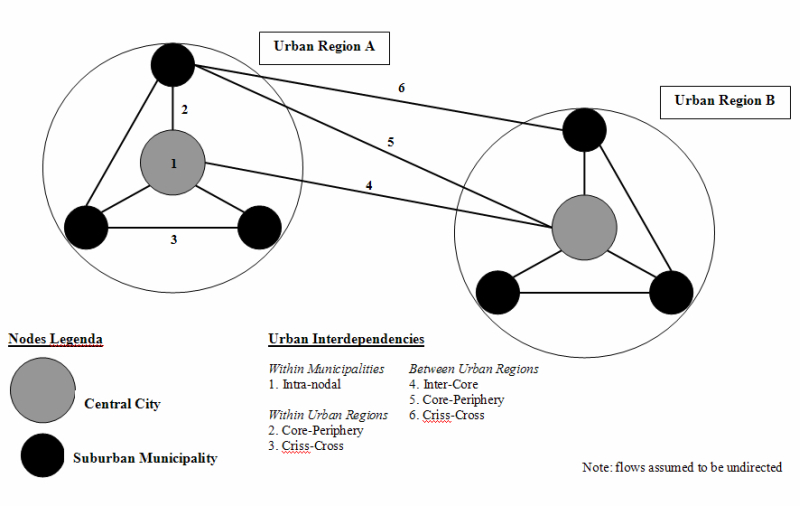
in which, In order to test the three specified conditions for spatial integration of municipalities in the Randstad region using a zero-inflated negative binomial model, we introduce dummy variables in our model that reflect the spatial-functional context of the economic interactions between types of localities (regimes). These regimes build up the degree of spatial integration in the Randstad region. We distinguish four core cities ( Amsterdam, Rotterdam, The Hague and Utrecht) with their suburban municipalities and introduce the following six types of urban interdependencies that convey the spatial context of flows between municipalities: A. Economic relations within municipalities:
B. Economic relations within urban (sub)regions of the Randstad:
C. Economic relations between urban (sub)regions:
The different types of urban interdependencies are displayed in Figure 4. Recall that if the Randstad can be characterised as a spatially integrated urban system (from an economic point of view), the regional network structure of inter-firm relations is solely determined by the masses of the municipalities and the physical distances between them; spatial context does not play any role, and there is no difference in the relative strength of the different types of interdependencies. The advantage of this testing system is that it is independent of the scale of regions and cities and can be applied in other settings (for a comparable test on urban network formation in the Greater South East UK, see De Goei et al., 2009). Figure 3: The network of inter-firm relationships in the Randstad
Figure 4: Classification of different types of urban interdependencies
Empirical ResultsTable 2 presents the estimates from the zero-inflated negative binomial regression model for the economic interaction intensity between municipalities in the Randstad region. Overall, the significance of the likelihood ratio test of overdispersion (α) and the Vuong-statistic indicate that the zero-inflated negative binomial model fits the data best, which justifies the choice of this model. As indicated above, the zero-inflated negative binomial model consists of two components. The negative binomial component corresponds to the estimates for those pairs of municipalities with non-strictly zero counts. The zero-inflated or binary component relates to the logit regression predicting whether an observation belongs to the ‘always zero’ or ‘not always zero’ group. Examining the zero-inflated component of the model, it can be observed that in three of the four models presented, only a low joint mass significantly increases the probability of belonging to the ‘always zero’ group. On average, an increase of 1% in the joint mass of the two municipalities decreases the likelihood of belonging to the non-strictly zero group by 0.60%, holding all other variables constant. This is in line with the finding that the largest share of non-interaction is between many small localities, where the critical mass to generate flows is lacking. In the remainder of our discussion of the empirical results, we focus on the negative binomial component of the regression model. Table 2: Zero inflated negative binomial models on economic interaction in the Randstad
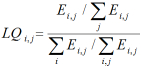
Model 1 in Table 2 represents the null or baseline model and only includes variables of the joint mass of the originating and destination municipalities and the physical distance between them. Recall that if the Randstad is functioning as one urban network, the joint mass and the physical distance between municipalities should solely determine the interaction intensity between municipalities in the Randstad. The other types of spatial interdependency should not play any role. As expected, economic mass has a marked direct correlation with the flow frequency between the municipalities, while distance has a marked inverse correlation. These values can be interpreted as elasticities: when physical distance increases by 1%, the interaction intensity of firm relations is predicted to decrease by 0.85%. Similarly, an increase in the joint mass of the two municipalities by 1% increases the predicted interaction intensity of firm relations by 0.91%. Model 2 in Table 2 tests the first condition for spatial integration, which states that the intra-nodal interdependency should not be stronger than interdependencies between municipalities within the Randstad region. In other words, the degree of spatial interaction between firms that remains within municipalities should not exceed the degree of interaction between municipalities. Controlling for mass and physical distance between municipalities in our model, it appears, however, that this condition is not met. The intra-urban interdependency is significantly stronger than interdependencies between municipalities situated in the same region as well as interdependencies between other municipalities. More specifically, the predicted interaction intensity within municipalities is about 75% higher than that between municipalities within the same region. Likewise, vis-à-vis interdependencies between municipalities not situated in the same region, this figure is approximately 110% (these marginal elasticities can be obtained by taking the natural exponent of the parameter estimates). In Model 3 in Table 2, the second condition for spatial integration is tested, which states that the interdependencies between cities within one of the urban (sub)regions in the Randstad should not be stronger than the interdependencies between cities across these (sub)regions. Also, this condition is not met. The interaction intensity between municipalities within the same region is predicted to be significantly higher than the interaction intensity between municipalities across urban (sub)regions. Holding mass and physical distance constant, the predicted flow between municipalities within the same urban region is over 30% larger compared to the inter-municipal flows that exceed the level of the urban region. In Model 4 in Table 2, we test the third condition for spatial integration, which states that there should be no observable hierarchy in the different types of inter-municipal interdependencies present. Taking inter-regional crisscross interdependencies as a reference category (as it is conceptually the weakest type of urban interdependency), we are able to compare the relative strength of the different types of the urban interdependencies, controlling for mass and distance. We conclude whether the interaction intensity significantly differed between the different types by using a Wald test to check the equality of coefficients. This way, we are able to compile a ranking list, in which the different types of urban interdependencies were ranked according to relative strength. From this analysis, we conclude that also the third condition for spatial integration is not met. Inter-core interdependencies between the four largest cities ( Amsterdam, Rotterdam, The Hague, and Utrecht) and intra-regional core-periphery interdependencies are the strongest types of urban interdependencies. Inter-regional core-periphery interdependencies and intra-regional crisscross interdependencies are the weakest types of relationships. As none of the three conditions for spatial integration is formally met in our tests, it can be concluded that the Randstad does not (yet) function as a spatially integrated cluster. Firm-relations appear to be both regionalised within the agglomeration level of the four (sub)regions, and inter-regionalised between the four larger cities3. The Functional Economic Integration of Randstad HollandMeasuring Functional Economic Integration and ComplementaritiesAlthough spatial integration is one prerequisite for urban complementarities, functional integration or the existence of a spatial division of labour is the other one. Functional economic integration presupposes a d ifferentiation between cities within the Randstad in terms of economic specialisations and functions, while at the same time a large degree of integration (the use of each other’s specialisations) reflects the existence and use of an aggregated regional production system. In this section, we test whether functional integration is present in the Dutch Randstad region. Since we simultaneously want to test for spatial integration (as defined in the previous section) and functional integration, we extend our gravity models on spatial interaction between firms with an indicator for functional integration. When firms in municipalities i and j have many mutual relations, this can be rooted in the fact that the local production structure in i is characterised by other – complementary – specialisations than that in j . For example, a city specialising in financial services provides these services to (firms in) a city specialising in labour-intensive industry, and vice versa (Lambregts et al. 2006). In theory, the business services specialisation in Amsterdam should lead to a large number of companies in other regions making use of these services, not least because the services are under-represented in their own immediate region. Companies outside Amsterdam are then able to specialise in another type of activity, which will then attract trading relationships from yet other regions. In this scenario, each region benefits from each other’s specialisation and will still have marked interactions with each other. Hence, cities do not have to be specialised in all possible sectors but can benefit from specialisations elsewhere in the urban network (Meijers, 2005). We speak of the presence of urban complementarities if functional integration coincides with or complements spatial integration. We measure the relative specialisation of municipalities by means of location quotients in 27 different basic sectors.4 Basic sectors are not dependent on the direct location of consumers for their location-choice 5, and hence firms in these sectors may profit from complementary specialisations in (nearby) cities. The location quotients are defined as:
in which E represents the number of firms or employment in region i and sector j. A score larger than one indicates that the sector is relatively over-represented in the region when compared to the Randstad on average. A score lower than 1 indicates the relative under-representation of a sector in a municipality. The location quotient is expressed in terms of employment and in terms of number of firms. The difference between the two reflects the average firm size in sectors in locations. It is a priori not clear whether specialisations of the number of firms or specialisations in employment are related to functional urban complementarities. We therefore weigh both equally in our indicator for functional integration (FI), which for each economic interaction between origin and destination municipalities (n=2346) is defined as 6:
in which LQo represents location quotients of origin municipalities, LQd represents location quotients of destination municipalities, E stands for employment, F for the number of firms and j for the 27 sectors distinguished. This indicator measures and aggregates all possible functional complementarities between the 27 sectors and between the 69 municipalities in the Randstad region. Functional complementarities at first are per municipality, expressed as a weighted average of the difference in specialisations between all potential origin and destination combinations. These differences are then matched with the actual origin and destination municipalities in the measured economic interactions between municipalities. Empirical resultsTable 3 presents – similar to Table 2 - the estimates from the zero-inflated negative binomial regression model for the economic interaction intensity between municipalities in the Randstad region, complemented with the indicator for functional integration.7 Overall, the likelihood ratio test of overdispersion (α) and the Vuong-statistic again indicate that the zero-inflated negative binomial model fits the data best. The zero-inflated component of the model reveals similar results as those presented in Table 2. Model 5 in Table 3 represents the null or baseline model when functional integration is included along with the variables of the joint mass of the originating and destination municipalities and the physical distance between them. The results indicate that there is no significant effect of functional integration on flow frequency between cities. Table 3: Zero inflated negative binomial models on economic interaction and functional integration in the Randstad
Model 6 in Table 3 shows a negative significant interaction effect of the functional integration indicator with the mass indicator of municipalities in origin and destination municipalities. This can be interpreted as weak evidence of functional integration within a group of relative small cities and municipalities in the Randstad. As these cities are too small to inhabit all economic functions individually, functional complementarities with nearby municipalities containing other specialisations occur. Larger cities have all the specialised resources needed for firm networks available within their boundaries. Models 7 and 8 introduce spatial and functional integration variables simultaneously in the model. While all spatial interaction variables show similar relations with firm interactions as presented earlier in Models 2-4 in Table 2, the introduction of the indicator for functional integration is only slightly significant, again only for smaller municipalities.8 ConclusionsIn this article, we examined whether the Randstad can be regarded as an urban network and an integrated economic entity. There is a need for this, since a burgeoning literature suggests that the polycentric region as a spatial economic concept replaces the hierarchical, central node concept. Camagni and Capello (2004) argue that polycentric urban regions only comprise a new paradigm in spatial sciences when (a) the exact meaning is defined, (b) the theoretical economic rationale is justified, and (c) the novel features of its empirical content are clearly identified and distinguished from more traditional spatial facts and processes that can be interpreted through existing spatial paradigms. The concept of spatial networks in the empirical literature is merely used as a substitute for ‘interaction’ (exchange of goods, services, information and contacts among places and nodes), for which traditional paradigms of spatial interaction can be utilised. For the concept of urban networks to be considered different than that of cities or urban agglomerations, the probability of inter-firm interaction should be independent of distance, the size of nodes and hierarchical relations between nodes. Functionally, the contention for different cities within an urban network to be complementary to each other requires that cities not only be specialised in different industries but at the same time also be showing a marked degree of spatial interaction and hence integration. To date, there has been little empirical research into the spatial and functional economic cohesion of urban networks, mainly because of the lack of data on inter-firm relations. As the Randstad combines Amsterdam (cultural capital), The Hague (political capital), Rotterdam (gateway) and Utrecht (central national position), together with numerous smaller cities and a highly skilled labour force, the region is traditionally regarded as the European showcase of regional polycentricity (Lambregts et al., 2006). Relationships between the cities date back centuries. No earlier empirical research tests whether this image is justified for present-day economic (inter-firm) relations. We tested for the spatial and functional integration of the Randstad and the presence of urban complementarities, relying on recently gathered data that derive from a large-scale survey of 1676 firm establishments in the region. We formulated a set of three conditions for spatial integration within the Randstad region. None of these three conditions for spatial integration was met. First, we found that intra-urban economic interdependencies are stronger than interdependencies between cities within the Randstad. Second, interdependencies between cities within one of the urban (sub)regions in the Randstad defined by the largest cities were stronger than interdependencies between cities across these (sub)regions. And third, an observable hierarchy in the different types of inter-municipal interdependencies in the Randstad is present in which central place relations prevail. Therefore, it can be concluded that the Randstad does not (yet) function as a spatially integrated network of cities. We then introduced an indicator for functional integration based on the differences in economic specialisations of origin and destination municipalities that are included in the firm relational network data. We found no clear evidence for functional integration over municipalities in the Randstad. Urban complementarities in the Randstad defined by spatial and functional integration between municipalities are thus currently not present. The largest cities – Amsterdam, Rotterdam, The Hague and Utrecht – are all mature nodes within their own functional economic region. Weak evidence for urban complementarities is only found for the smallest municipalities that cannot accommodate all economic functions within their boundaries. The economic (inter-firm) dimension of urban networks has not been put to an empirical test systematically. Our research results question the many policy attempts to create and sustain polycentric economic development trajectories in Europe. When economic complementarities based on inter-firm linkages do not exceed the (monocentric) city-region in the ‘archetypical polycentric’ Randstad, it is doubtful that policy aiming at higher-level interaction can be justified outside of wishful thinking. Our results suggest that a focus on the daily urban systems (DUS) of the four largest cities fits the spatial-economic reality better. Recall that 50 percent of the inter-firm relations are with (inter)national regions outside the Randstad, which causes spatial and functional dependencies to transcend the DUS. However, the scale of the polycentric urban region appears to be skipped in the so-called ‘local-global economic development trajectories’ (Bathelt et al., 2004). More comparable research in other regions should be carried out in order to confirm or confront this outcome. The testing system introduced is independent of the scale of regions and cities and can therefore be applied to this end. We think that this testing system, although strictly formulated, is advantageous for the testing of hypotheses. Less strict testing will to our opinion leave much room for speculation on the potential (policy) usage of the urban network paradigm. It is also important to repeatedly measure inter-firm relationships. Although commuting and shopping relations do not suggest a profound development towards more inter-regional network formation in the Randstad for the last 20 years (RPB, 2006), inter-firm relations may develop in that direction over time. REFERENCESAGRESTI, A. (2002) Categorical Data Analysis, New Jersey: John Wiley & Sons . ALONSO, W. (1964) Location and Land Use, Cambridge MA: Harvard University Press. ANAS, A., ARNOTT, A., SMALL, K.A. (1998) Urban spatial structure, Journal of Economic Literature, 26, pp. 1426-1464. AOYAMA, Y. and CASTELLS, M. (2002) The informational society, an empirical assessment: employment and occupational structures of G-7 countries in the 1990s, International Labour Review , 141, pp. 123 – 159. BAILEY, N. and TUROK, I. (2001) Central Scotland as a polycentric urban region: useful planning concept or chimers?. Urban Studies, 38, pp. 697-715. BATHELT, H., MALMBERG, A. and MASKELL, P. (2004), Clusters and knowledge: local buzz, global pipelines and the process of knowledge creation, Progress in Human Geography, 28, pp. 31-56. BATTEN, D.F. (1995) Network cities: creative urban agglomerations for the 21 st century, Urban Studies, 32, pp. 313-327. BRÖCKER, J. (1989) How to eliminate certain effects of potential formula, Environment and Planning A, 21, pp. 817-830. BOURNE, J. S. and SIMMONS J. W. (Eds) (1978) Systems of Cities. Oxford: Oxford University Press. BURGER, M., VAN OORT, F.G. and LINDRS, G.J. (2009), On the specification of the gravity model of trade: zero’s, excess zero’s and quasi-Poisson estimation, Spatial Economic Analysis (forthcoming). BURGESS, E.W. (1925) The Growth of the City, Chicago: University of Chicago Press. CAMAGNI, R. and CAPELLO, R. (2004) The city network paradigm: theory and empirical evidence’, in R. Capello and P. Nijkamp (Eds) Urban Dynamics and Growth, pp. 495-529. Amsterdam: Elsevier. CAMERON, A.C. and TRIVEDI, P.K. (1986) Econometric models based on count data: comparisons and applications of some estimators and tests, Journal of Applied Econometrics, 1, pp. 29-53. CAPELLO, R. (2000) The city network paradigm: measuring urban network externalities, Urban Studies, 37, pp. 1925 – 1945. COE, N.N. and TOWNSEND, A.R. (1998) Debunking the myth of localized agglomerations: the development of a regionalized service economy in South-East England, Transactions of the Institute of British Geographers 23, pp. 385-404. COMBES, P.P. (2000) Economic structure and local growth: France 1984-1993, Journal of Urban Economics, 47, pp. 329-355. CURRAN, J. and BLACKBURN, R. (1994) Small firms and local economic networks. The death of the local economy? London: Paul Chapman Publishing. DAVOUDI, S. (2003) Polycentricity in European spatial planning: from an analytical tool to a normative agenda?, European Planning Studies 11, pp. 979 – 999. De GOEI, B., BURGER, M., VAN OORT, F.G. and KITSON, M. (2009) Functional polycentrism and urban network development in the Greater South East UK: evidence from commuting patterns, 1981-2001, Regional Studies (forthcoming). DIELEMAN, F.M. and S. MUSTERD (1992) The Randstad: A Research and Policy Laboratory. Dordrecht, Kluwer. FINGLETON, B. (2003) Externalities, economic geography and spatial econometrics: conceptual and modelling developments, International Regional Science Review, 26, pp. 197-207. FLOWERDEW, R. and AITKIN, M. (1982) A method of fitting the gravity model based on the Poisson distribution, Journal of Regional Science, 22, pp. 191-202. FROST, M.E. and SPENCE, N.A. (1995) The rediscovery of accessibility and economic potential: the critical issue of self-potential, Environment and Planning A, 27, pp. 1833-1848. GLAESER, E.L. (2007) Do regional economies need regional coordination?, in K.S. Goldfiled (Ed.) The Economic Geography of Megaregions, Princeton: Princeton University, pp.11-57.. GLAESER, E.L., KALLAL, H.D., SCHEINKMAN, A. and SHLEIFER, A. (1992) Growth in cities, Journal of Political Economy, 100, pp. 1126-1152. GARREAU, J. (1988) Edge city. Life on the new frontier, New York: Anchor Books. GEYER, H.S. (2002) On urban system evolution, in H.S. Geyer (Ed) International Handbook of Urban Systems, Cheltenham: Edward Elgar. GOURIEROUX, C., MONTFORT, A. and TROGNON, A. (1984) Pseudo maximum likelihood methods: applications to Poisson models, Econometrica, 52, pp. 701-720. GRAHAM, S. and MARVIN, S. (2001) Splintering Urbanism, Networked Infrastructures, Technological Mobilities and the Urban Condtion, London: Routledge. GREEN, N. (2007) Functional polycentricity: a formal definition in terms of social network analysis, Urban Studies, 44, pp. 2077-2103. HALL, P. (1996) The World Cities, London: Weidenfield and Nicolson. HALL, P. (2001) Global city regions in the twenty-first century, in A.J. Scott (Ed) Global City Regions, Oxford: Oxford University Press, pp.59-77. HALL, P. and PAIN, K. (2006) The polycentric metropolis. Learning from mega-city regions in Europe, London: Earthscan. HAYNES, K.E. and FORTHERINGHAM, A.S. (1984) Gravity and Spatial Interaction Models. London: Sage. HOHENBERG, P.M. and LEES, L.H. (1985), The Making of Urban Europe1000-1950, Cambridge (MA): Harvard University Press. HOYLER, M., R.C. KLOOSTERMAN and M. SOKOL (2008) Polycentric puzzles – emerging mega-city regions seen through the lens of advanced producer services, Regional Studies 42, 1055-1064. HORAN, T.A, CHINITZ, B. and HACKLER, P. (1996) Stalking the invisible revolution. The impact of information technology on human settlement patterns, Claremont: University Research Institute. KLOOSTERMAN, R.C., LAMBREGTS, B. (2001) Clustering of economic activities in Polycentric Urban Regions: the case of the Randstad, Urban Studies, 38, pp. 717-732. KOLKO, J. (2002) Silicon mountains, silicon molehills: geographic concentration and convergence of internet industries in the US, Information Economics and Policy, 14, pp. 211-32. LAMBREGTS, B., KLOOSTERMAN, R., VAN DER WERFF, M., ROLING, R. and KAPOEN, L. (2006) Randstad Holland: multiple faces of a polycentric role model, in P. Hall and K. Pain (Eds.) The polycentric metropolis. Learning from mega-city regions in Europe, London: Earthscan, pp. 137-145. LAMBREGTS, B. (2008) Geographies of knowledge formation in mega-city regions: some evidence from the Dutch Randstad, Regional Studies 42, pp.1173-1186. LAMBOOY, J.G. (1998) Polynucleation and urban development: the Randstad, European Planning Studies, 6, pp. 457-467. LIMTANAKOOL, N., DIJST, M. and SCHWANEN, T. (2007) A theoretical framework and methodology for characterizing national urban systems on the basis of flows of people: empirical evidence for France and Germany, Urban Studies, 44, pp. 2123-2145. LONG, J.S. (1997) Regression Models for Categorical and Limited Dependent Variables, Thousand Oaks: Sage. MEIJERS, E. (2005) Polycentric urban regions and the quest for synergy: is a network of cities more than the sum of its parts?, Urban Studies, 42, pp. 765-781. MEIJERS E. (2007) From a central place to a network model: theory and evidence of a paradigm change, Tijdschrift voor Economische en Sociale Geografie, 98, pp. 245-259. NOOTEBOOM, B. (1999) Inter-firm alliances. Analysis and design, London: Routledge. PARR, J.B. (1999) Growth-pole strategies in regional economic planning: a retrospective view, Urban Studies, 36, pp. 1195-216. PARR, J.B. (2004) The polycentric urban region: a closer inspection, Regional Studies, 38, pp. 231 – 240. PHELPS, N and OZAWA, T. (2003), Contrasts in agglomeration: proto-industrial, industrial and post-industrial forms compared, Progress in Human Geography, 27, pp. 583-604. PRED, A. (1973), Urban growth and the circulation of information: the United States system of cities 1790-1840, Cambridge Mass.: Harvard University Press. PRED, A. (1977) City systems in advanced economies: past growth, present processes and future development options, London: Hutchinson. RENKOW, M. and HOOVER, D.M. (2000) Commuting, migration and rural-urban population dynamics, Journal of Regional Science, 40, pp. 261 – 287. ROSENTHAL, S.S. and STRANGE, W.C. (2003) Geography, industrial organization, and agglomeration, Review of Economics and Statistics, 85, pp. 377-393. ROSENTHAL, S.S. and STRANGE, W.C. (2004) Evidence on the nature and sources of agglomeration economies, in J.V. Henderson and J.F. Thisse (Eds.) Handbook of regional and urban economics: cities and geography, Amsterdam: Elsevier, pp 2119-2179. RPB (2006) Vele steden maken nog geen Randstad, Rotterdam: NAi Publishers and Netherlands Institute for Spatial Research (RPB). SACHAR, A. (1994) Randstad Holland: a world city?, Urban Studies, 31, pp. 381-400. SCOTT, A.J. (1988) Metropolis. From the division of labor to urban form, Berkeley: University of California Press. SEN, A. and SMITH, T.E. (1995) Gravity Models of Spatial Interaction Behaviour. Heidelberg: Springer. SMITH, D.M. (1971) Industrial location. An economic geographical analysis, New York: Wiley. VAN DER BURG, A.J. and DIELEMAN, F.M. (2004) Dutch urbanisation policies: from compact city to urban network, Journal of Economic and Social Geography (TESG) 95, pp. 108-116. VAN DER LAAN, L. (1998), Changing urban systems: an empirical analysis at two spatial levels, Regional Studies, 32, pp. 235-247 . VAN HAM, M. (2002) Job Access, Workplace Mobility, and Occupational Achievement. Delft: Eburon. VAN OORT, F.G. (2007) Spatial and sectoral composition effects of agglomeration economies, Papers in Regional Science, 86, pp. 5-30. VROM (2008), Structural Vision Randstad 2040. Towards a sustainable and competitive European top region. The Hague: Ministry of Spatial Planning and the Environment (VROM). VUONG, Q.H. (1989) Likelihood ratio tests for model selection and non-nested hypotheses, Econometrica, 57, pp. 307-333.
NOTES* Frank G. van Oort, Department of Economic Geography, Utrecht University & Netherlands Institute for Spatial Research (RPB), The Hague. Email: f.vanoort@geo.nl ** Martijn J. Burger, Department of Applied Economics, Erasmus University Rotterdam. Email: mburger@ese.eur.nl *** Otto Raspe, Department of Economic Geography, Utrecht University & Netherlands Institute for Spatial Research (RPB), The Hague. Email: otto.raspe@pbl.nl 1. Over the last 20 years, the average distance of shopping activities of consumers has not grown significantly in the Netherlands, either (RPB, 2006). 2. A more extensive discussion of zero-inflated estimation in relation to spatial interaction models can be found in Burger et al. (2009). 3. Because agglomeration economies differ across industries (Rosenthal and Strange, 2004), we tested for the robustness of the degree of spatial integration in interaction models for manufacturing, distribution and business service activities separately. Since industrial activities are to a considerable extent also located outside the Randstad (Van Oort, 2004), the model of business services resembles the (total) model presented to a large degree. Because we are interested in functional integration by means of detailed cross-sectoral interdependencies (see section 5), we did not explore the three sector-specific interaction models any further. 4. These 27 sectors are (in brackets sectoral Dutch sectoral SBI-codes): the food and beverage industry (15), the tobacco industry (16), the textile industry (17), the clothing industry (18), the leather and leather goods industry (19), the timber industry (20), the paper industry (21), the oil and coal industry (23), the chemical products industry (24), the rubber industry (25), the glass and ceramics industry (26), the primary metal industry (27), the metal products industry (28), the machine industry (29), the computer industry (30), the electronics industry (31), the audio and telecom industry (32), the medical equipment and instruments industry (33), the car industry (34), the transportation equipment industry (35), the furniture industry (36), wholesale (51), the publishing industry (22), telecommunication services (64), computer services and consultancies (72), the research & development and knowledge institutions (73), the remaining business services (74). 5. Non-basic sectors are retail, primary education and schools, local public services like police, fire departments and healthcare, and local and regional governments. 6. Analyses with location quotients for employment and the number of firms present in municipalities separately give similar results to those presented. Also, other (aggregated) definitions of sectors do not change the outcomes. 7. Correlations between explanatory variables in the models are not higher than 0.4, meaning there is little risk of multicollinearity problems. 8. For both model 6 and 8, we find no significant interaction effect of functional integration and distance. For this reason, this interaction term is omitted from our final models.
Note: This Research Bulletin has been published in Urban Studies, OnlineFirst, (2010) |
|||||||||||||||||||||||||||||||||||||||||||||||||||||||||||||||||||||||||||||||||||||||||||||||||||||||||||||||||||||||||||||||||||||||||||||||||||||||||||||||||||||||||||||||||||||||||||||||||||||||||||||||||||||||||||||||||||||||||||||||||||||||||||||||||||||||||||||||||||||||||||||||||||||||||||||||||||||||||||||||||||||||||||||||||||||||||||||||||||||||||||||||||||||||||||||||||||||||||||||||||||||||||||||||||||||||||||||||||||||||||
 (1)
(1) (2)
(2)
 (4.1)
(4.1)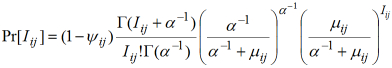 , (4.2)
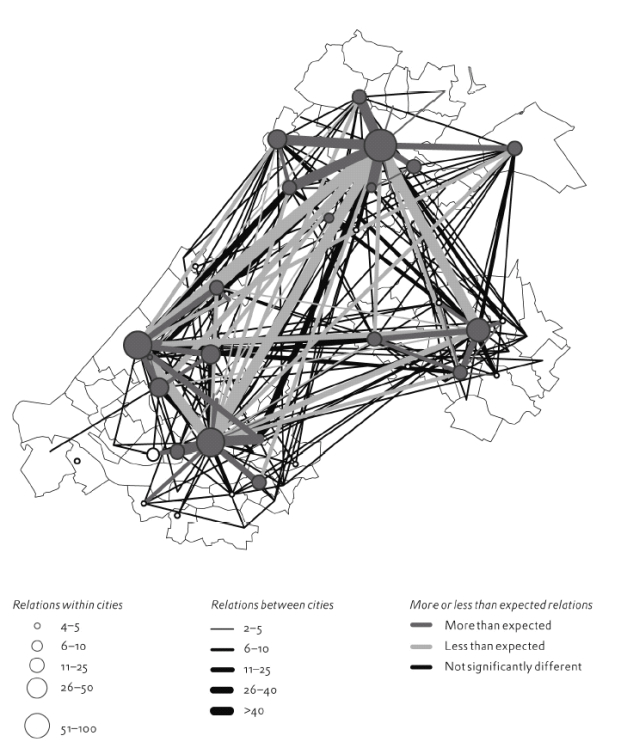
 , (5)
, (5)