GaWC Research Bulletin 209 |
|
|
|
A later version of this Research Bulletin has been published in Geography Compass, 3 (2), (2009), 836-855, under the title 'From North-South to 'Global' South? An Investigation of a Changing 'South' Using Airline Flows between Cities, 19702005' doi:10.1111/j.1749-8198.2009.00216.x Please refer to the published version when quoting the paper.
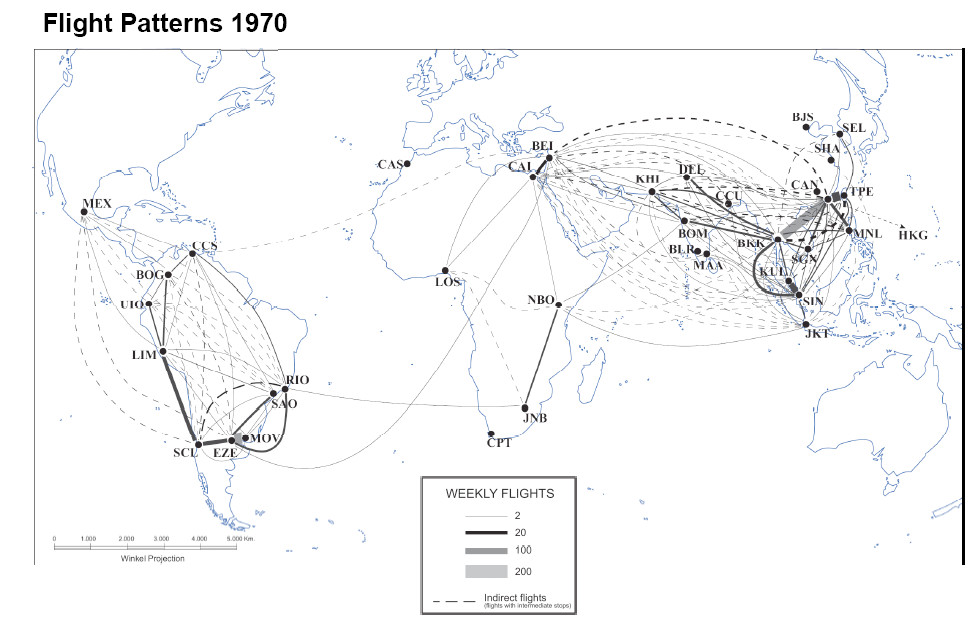
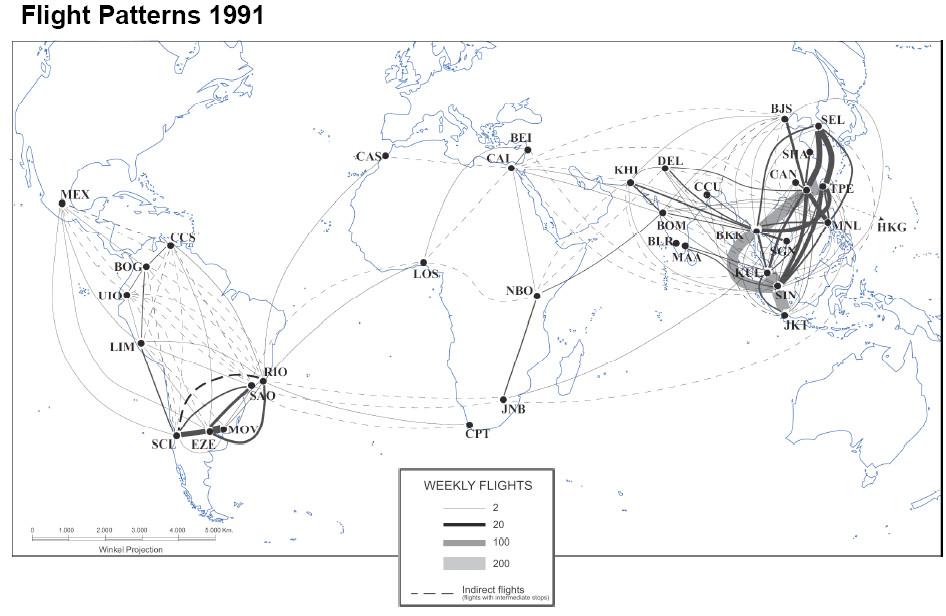
A. INTRODUCTIONIn the last decade the term ‘Global South’ has become a new favoured term to describe the poorer countries of the world. Widely used across academia– for instance, in environmental studies (Peritore 1999), in political science (Braveboy-Wagner 2003), in economics (Soederberg 2005), and in geography (Rigg 2007) – it has been adopted by UN agencies (UNDP 2003. 2004) making the term in some sense ‘official’. In latter case, Global South indicates a political position, a refusal to be an ‘object’ of globalization. Globalization, though not neo-liberalism, is accepted but on negotiated terms: Global South defines itself as a bargaining ‘subject’ within globalization. As a challenge to the contemporary dominant globalization discourses emanating from rich countries, the use of the term Global South evokes a previous challenge by poor countries to the way in which richer countries were scripting the world. By the 1970s decolonisation had led to poor countries becoming a majority of the General Assembly of the UN and in 1974 they demanded a New International Economic Order to support an economically failing ‘South’. This was an attempt to subvert the East v.s West scripting of the world for the Cold War security agenda by a “North v.s South’ division of the world for an economic development agenda. The Cold War’s East and West were thus conflated into a single North of richer countries in order to generate a ‘North-South dialogue’ on development. The main outcome was the Brandt Report to the UN in 1980; entitled North-South: A Programme for Survival it had on its cover the famous ‘one line’ map of the world showing just a single boundary stretching across the world to separate North from South (Independent Commission on Development Issues 1980). This 1970s challenge faltered in the wake of the debt crisis in the early 1980s followed by the fall of the Soviet Union in 1989-91 leading to the globalization scripting of the world as a simple neo-liberal unity in the 1990s. The term Global South puts the split back into this global scripting of the world: it is saying despite the massive economic and political changes in recent decades, there remains a fundamental division of rich and poor countries to be addressed. There are, of course, significant differences between the ‘South’ half of the 1970s North-South divide and today’s Global South. Earlier South demands of the North are replaced by a stronger emphasis on ‘South-South’ relations of cooperation and mutual support. The current terminology does imply a ‘Global North’ but this only appears as a partner in ‘Triangular Cooperation’, the North joining South-South projects (UNDP 2003, 4). Thus there is continuity in the goal of these two ‘South projects’ – reducing worldwide material inequalities - but the strategy for achieving this end has changed markedly. However, the continuity is politically important because it is saying that in a renewed world security agenda with its new ‘East v,s West’ script (the ‘War on Terror’), the South is still here and insists having a voice in global agenda-setting. This paper has two basic purposes. First, we investigate geographical changes from ‘divide South’ to Global South’. There may be good political reasons to hark back to the 1970s in contemporary UNDP practices but this cannot hide the fact that the huge political and economic changes of the last three decades have impacted on the South as well as the North. In fact, the credibility of the globalization label stems, in part, from the rise of Pacific Asia to provide a global balance to the traditional economic dominance of North America and Europe. Nevertheless, the UNDP continues to define its Global South zone in East Asia as geographically identical to the 1970s ‘divide South’, with just Japan allocated to the North in both cases. Thus we can expect the new geography that is globalization to seriously challenge the ‘old’ South concept. Traditionally, the South has been defined as the three ‘third world’ continents of Latin America, Africa and Asia (minus Japan) but since the 1970s these have fared very differently: as the world economy has globalized a very definitive ranking of the continents has arisen with Asia (especially Pacific Asia) first, Latin America second, and with Africa coming a poor third. The empirical purpose of this paper is to illustrate the geography of these changes using airline data from 1970 to 2005. Second, we promote a particular way of conceptualising how change can be studied across the two ‘Souths’. The UN has always defined the South as a collection of countries, which is, perhaps, not surprising given that its members are states. Viewing the South in this manner has the particular advantage of accessibility to myriad data for illustrating North-South differences using national statistics conveniently brought together in UN publications. But this is to be data-led, with the state-centric approach dictated from outside the research process. Quite simply states are problematic on both empirical and theoretical grounds. Treating China, India, Indonesia, South Africa, Argentina, Brazil and Mexico as equivalent entities to Kiribati, Naura, Tuvalu, Sao Tome and Principe, Saint Lucia, Saint Kitts and Nevis, and Saint Vincent and the Grenadines is necessary for the UN since they are all sovereign members, but this should not mean we have to follow such a geographically nonsensical lead. Following Jacobs (1984, 2000), we consider cities and their regions as the basic economic entities for analysis of economic change. The ranking of the three continents is a direct expression of where vibrant cities have emerged since 1970 – many in Asia (especially Pacific Asia), some in Latin America, and very few in Africa. Thus the reason we are using airline data in this study is because these are available statistics that pinpoint flows in and out of cities. The conceptual purpose of this paper is to illustrate a relational geography of a changing South with a focus on cities. This second purpose comes with a theoretical caveat. The concept Global South derives from mind-set that is overtly political and therefore with a tendency to engage with issues from a territorial perspective, the world as a space of places as Castells’s (1996) describes it. This is to see the world from, what Jacobs (1992) describes as a ‘guardian’ position. In contrast, our relational approach centred on cities derives from a mind-set that is commercial in nature and engages in issues from network perspective, the world as a space of flows to continue with Castells’s (1996) concepts. This commercial perspective is contrary to the guardian perspective: Jacobs (1992) develops her theory of different moral syndromes for guiding behaviours in making a living directly on this opposition. What this means for this paper is that we are evaluating a concept generated through guardian thinking (a political space of places) within a commercial-thinking framework (an economic space of flows). This should lead inevitably to tensions in interpretation and discussion of results. We will treat this as a creative tension and exploit it in the conclusion: a theoretical interpretation to what is essentially an empirical paper. The paper is divided into three parts. First, we describe our methodology in terms of the data used and how we analyse them geographically. Second, we describe the pattern of change across the South from 1970 through to 1995. Third we take a detailed look using unique data to provide a cross-section of geography of the South in 2001. A short conclusion draws out the findings in relation to the guardian-commercial tension. B. METHODOLOGYa. Spatial FrameworkBecause we have eschewed using state collected data we are able to define our own spatial framework. As previously noted the ‘South’ we are studying has been defined in terms of countries and continents. First as regards the latter, we follow Lewis and Wigen’s (1997) argument on the inadequacy of continents as a geographical framework and accept their argument for using world regions. They divide the world into a reasonably coherent set of regions that we broadly follow for our South analyses. We identify six regions: Latin America, Sub-Saharan Africa, North Africa and the Middle East, South Asia, South East Asia. and East Asia. For this “South analysis’ we exclude Japan from the latter, but otherwise these regions are as conventionally defined. Because we are dealing with relational geographies it follows that we do not need to be concerned for exactly bounding our regions. Our relational geographies focus on cities and city-dyads. Using evidence from previous studies of the contemporary world city network (Taylor 2004), we have selected 35 ‘South’ cities that have been shown to be important in globalization.1 These are listed in Table 1 along with their world region. The cities are reasonably worldwide across the South but with two regions relatively underrepresented. Sub-Saharan Africa has just 4 cities and this represents the paucity of major cities in the world city network from this region. The North Africa and the Middle East region has only 3 cities but this is because we have omitted cities in capital-rich oil exporting states ( Abu Dhabi, Dubai, Jeddah, Kuwait City, Manama and Riyadh). These cities have never been part of the ‘South’ in the sense that it represents the poor countries of the world; the geographical accident of large oil reserves in low population density countries has created completely different geopolitical processes of economic change compared to the South in general. We will not be concerned with this particular process here. Because we are describing relational geographies, our spatial framework is constituted by inter-city-dyads; since there are 35 cities in this study, the empirics of this paper are drawn from 595 city-dyads. To measure the flows connecting dyad cities, we use two sets of data; one that is publicly available and another that we have particular access to. b. Data-set 1 – World-wide Airline Routes 1970-2005We need a data set that provides a basic historical overview and therefore transcends the usual span allocated to contemporary globalization. Not easily accessible in the usual ‘official data’ from IATA (International Air Travel Association) and other organizations such as CIAO (Civil International Air Travel Organization), we have found the information we require in ‘unofficial’ sources: the ABC world airways guides, now called OAG flight guide. Produced by a private company, Reed Travel Group now OAG Worldguide Limited, these guides have been published since the 1960s. This group has the approval in its publications by IATA and gets its information every month from different air travel companies. Air travel companies send information about their airlines trips to the publishing group who combine all the information to make their airline guides. The guides provide a range of information on fares and timetables and we focus on the information about the number of weekly flights between cities of the world. Focussing on our chosen 35 ‘south’ cities, we have abstracted data for 1970 representing the relational world geography before globalization, for 1991 representing globalization at the end of the Cold War, and for 2005 representing contemporary relational world geography. c. Data-set 2 – World-wide Origin-Destination Travel 2001Our second data source is the ‘MIDT-database’ (Marketing Information Data Transfer, described in more detail in Derudder and Witlox (2005a)). This database contains information on bookings made through Global Distribution Systems (GDS) such as Galileo, Sabre, and Amadeus. GDS are electronic platforms used by travel agencies to manage airline bookings (i.e. the selling of seats on flights offered by different airlines), hotel reservations, and car rentals2. With the cooperation of an airline, we were able to obtain an MIDT database that covers the period from January to August 2001 and contains information on more than 500 million passenger movements. This database was used to construct an inter-city matrix detailing the total volume of passenger flows between our selection of cities in the Global South. The key advantage of the MIDT data is that it provides specific information on passenger trips so that actual origin and destination matrices are created. With flight data, where there are one or more flight changes in a journey, trips are broken up into several separate flights. With MIDT data we can focus on the overall trip thus avoiding, for instance, the data distortions due the airlines favouring certain cities as their ‘hubs’. It is very rare for academic researchers to have access to such detailed information and, as noted, we have it for only part of one year, 2001. Thus the MIDT data provide an information goldmine for a cross-sectional analysis, for creating a relational geography for the beginning of the twenty first century. Below we report flows between our 35 ‘south’ cities, in terms of both total flows and as weekly flows at a variety of dyad scales. The latter flows are computed to ease interpretation of the results, the numbers can be imagined whereas the much larger totals for the arbitrary period for which the data is available are useful for comparisons but remain difficult to comprehend in themselves. Clearly the two data sets are quite different but complement each other: the first data set provides the dynamic context, the second data set provides a near-contemporary detailed geography. C. International airline flights in the Global South, 1970-2005The results from the long-term data are illustrated as three maps (Figure 1a, b and c). These maps show very clearly the intensification of contrast in the relational geographies of the Global South. In 1970 (Figure 1a) the ranking of the three ‘third world continents’ is already obvious and East Asia and South East Asia have the densest network. This pair of regions appears as a single ‘Pacific Asia’ mega-region. Although Latin America has a less dense network, it is not especially far behind Pacific Asia at this time. But Africa already stands out for its paucity of flights. In the period to 1991 (Figure 1b) there is little change in all regions except the two Pacific Asian regions where a large intensification of the airline networks occurs – this is the period when Pacific Asia consolidates its position as the ‘developing world that actually develops’. There is one other small but noteworthy change, the two leading cities of North Africa and the Middle East, Cairo and Beirut, lose most of their airline connections to Pacific Asia. By 2005 (Figure 1c) there is a general increase in airline densities across the Global South with even additions in Africa, and with Latin America intensifying its network, but these changes continue to be outstripped by continual spiralling of Pacific Asian airline links. The end result of these processes is a bifurcated Global South consisting of a Pacific Asian core with links to other Afro-Asian regions, and a separated Latin America with increased network density but remaining below the level of Pacific Asia in 1970. D. Airline travel in 2001: Inter-city links within the Global SouthAs previously noted, the air travel data improves on flight statistics by including all travel in an origin and destination format thus eliminating the ‘hub effect’ inherent in airline company policies. Unfortunately such data is rare and we have it for just one period in 2001. The resulting cross-sectional analysis of inter-city relations at the beginning of the twenty first century is reported in four increasing scopes of operation. We begin with intra-state flows, we then move onto international travel between cities within world regions, between adjacent world regions, and finally between non-adjacent world regions. There are only four countries that have more than one city in our data: India with 5, China with 4, and Brazil and South Africa with two each. This produces 18 intra-state city-dyads with weekly flows ranging from many thousands to just a few hundred (Table 2). By far the highest flow is between Rio de Janeiro and Sao Paulo which reflects their joint development as Brazil’s polycentric economic core region (Tolosa 2003; Rossi et al 2006). Although there are no equivalent combined city regions developing in the other countries, the top six flows all represent the leading commercial centres, Hong Kong, Johannesburg, Mumbai and Sao Paulo linking to other cities in their respective countries. Since none of these four cities are their country’s political capital, it follows that the relational geography we are tracing here is primarily commercial rather than political. This will not be so self evident in other analyses dealing with international flows because of the other 22 cities, 18 are capitals (the exceptions are Casablanca, Ho Chi Minh City, Karachi, and Lagos). At the intra-regional scale there are many city-dyads, Table 3 shows dyads with flows of more than 50,000 reported in the data. The table is dominated by the two Pacific Asian regions; the top 5 flows are of dyads including either Hong Kong or Singapore, the two regional centres. Latin American city-dyads are also well represented with 13 city-dyads in the table. In contrast, the other three regions have only one dyad each in the table: Beirut-Cairo, Johannesburg-Nairobi and Karachi-Mumbai. In the case of the latter dyad this is an artefact of all but one of South Asia’s selected cities being in one country ( India). In the other two cases it reflects the dearth of selected cities in North Africa/Middle East and Sub-Saharan Africa. In addition note also the low ranking of the latter two regions’ leading dyads in the table. Clearly, these two regions have meagre inter-city passenger flows compared with the rest of the Global South. This tallies with our previous conclusions drawn from flight data (Figure 1a, b and c). At the inter-regional scale we initially separated the flows into two groups: those between cities in adjacent regions and those between cities in non-adjacent regions. For the former we used the same cut-off point of 50,000 passengers as used for reporting intra-regional city-dyads. However this resulted in the Table being completely dominated by dyads of East Asian and South East Asian cities. Thus we produced two tables: Table 4(a) shows the East Asian-South East Asian city-dyads and Table 4 (b) shows other dyads not linking these two regions. For the latter the threshold for reporting dyads has been reduced to 5,000 passengers as a means for getting a more widespread pattern. More on this later, but the key point that emerges from this part of the research is that Table 4(a) is much more like Table 3 than Table 4(b). In other words, in terms of passenger flows, Pacific Asia appears to be a single world region. For instance, the inter-city-dyad with most distance between the cities, Bangkok-Seoul, in Table 4(a) has a larger passenger flow than any dyad flow in Table 4(b). Thus although it has long been conventional to distinguish between East Asia and South East Asia (as we began here following Lewis and Wigen (1997)), contemporary globalization appears to have been instrumental in merging them into a single Pacific Asian region. This reinforces the same finding from the flight data (Figure 1a, b and c). We can now return to ‘real’ inter-regional dyads in Table 4(b). Here we find another domination, this time of dyads including South Asian cities with Pacific Asian ones. Generally, not as large as in Table 4(a), nevertheless they constitute all 10 city-dyads above the original threshold and the next 9 ranked dyads in Table 4(b). Clearly this shows a potential for a larger Asian region stretching from Karachi to Seoul. There are only 5 city-dyads beyond this large Asian region, all with African links: Cairo with Johannesburg, Nairobi, Karachi, and Mumbai, and Lagos with Beirut. The failure of Latin American cities to feature in this table is simply because their only adjacent region is in the ‘North’; their more far-flung links will be recorded in the non-adjacent regional links. Table 5 shows 21 dyads of cities in non-adjacent regions with flows over 5,000 passengers. These are what are usually termed ‘inter-continental links’ and are made up of 11 trans-Indian Ocean dyads, 7 trans-Pacific dyads and 3 trans-Atlantic dyads. The domination of trans-Indian Ocean links is confirmed by the ranking of the dyads: although none of the passenger flows reaches 50,000, there are three large flows over 40,000 passengers: Mumbai-Nairobi, Hong Kong-Johannesburg, and Johannesburg-Mumbai. These three trans-Indian Ocean dyads linking Africa to Asia are perhaps the most surprising result from this analysis. They confirm the previous airline flight analysis (Figure 1c) where Africa’s eastern links have been consolidated compared to western links in the South. The importance of Johannesburg in Africa is confirmed by its membership of 7 of the top ten city-dyads in Table 5. Only two of these are trans-Atlantic links; with Sao Paulo and Buenos Aires. The highest trans-Pacific dyad is the Buenos Aires-Kuala Lumpur link but all trans-Pacific links are ranked in the bottom 8 in Table 5. If ‘trans-oceanic’ links ultimately define the Global South as ‘global’, it is clear that the Africa-Asia link – the Indian Ocean city-dyads – are the central relations. E. ConclusionThe Global South is an archetypal guardian concept. For the United Nations Development Programme (2003, 2004) it is purposely defined in terms of states in continents: to be territorially precise, 53 in Africa, 59 in Asia and 33 in Latin America/Caribbean. Its work explicitly draws upon ‘a new concept’ that is ‘international cooperation for development’, attributed to its head organization, the United Nations (UNDP 2003, 2). But there is a potential contradiction here. States are notorious for their conflictual behaviour in territorial zero-sum games. In contrast the basic source of mutuality in social transactions is commercial behaviour operating through contracts and markets (Jacobs 1992). Thus it is no surprise that in her seminal work on the expansion of economic life and development, Jacobs (1984, chapter 10) describes in detail ‘why backward cities’, not countries, ‘ need one another’. And we have shown clearly above how inter-city relations in the Global South have grown to become myriad large flows of passengers by the early twenty first century. This is encouraging; Jacobs’ (1984) message is that development is not something a state can simply buy into, it has to be grown indigenously through cities and their relations with other cities (Taylor 2006a). This is an immensely complex process far beyond the ken of states for whom social simplification is their generic starting point (Scott 1998; Taylor, 2006b). These arguments are the basis of our relational approach that focuses on cities above. Even though we have limited ourselves to just 35 cities compared to the UNDP’s 145 countries, our relational analysis generates a potential of 595 city-dyads to produce a much more complex picture than simple mapping of Global South as a mosaic of states. If the approach is more complex the results are even more so. The UDPM’s ‘geography’ for understanding the processes underlying their development purpose is a functional taxonomy of countries by ‘economic status’ (UNDP 2003, 2004). In contrast our myriad city-dyads of variable flights and passenger flows defines a complex geography; when our argument reaches the passenger flows, the geography has had to be expressed through tables because cartography cannot adequately depict the multifarious patterns of links. But through the complexity a key pattern does emerge that undermines the guardian concept of a single Global South. There appears to be an Atlantic fault line separating Latin America from the rest of the Global South. And this rest has a distinctive relational geography. There are Pacific Asian cities, combining East Asia and South East Asia, at its centre, with South Asian cities forming a strongly related appendage, possibly a precursor to expanding the centre, and with North Africa/Middle Eastern cities and Sub-Saharan African cities having their main trans-oceanic links in this direction. This is not to say that there are not strong inter-city relations involving Latin American cities but that they are strongly intra-regional only. How is this to be interpreted? While the UNDP has been nurturing political links between states across three continents to forge a Global South, commercial processes - that is processes of economic development through cities - have been busy bifurcating their Global South to generate an ‘East-West relational divide’. Thus there is a disjuncture between the guardian politics of the United Nations and the commercial economics of contemporary globalization. But this UN Global South politics is not the prime guardian reaction to globalization. According to Ikeda (2004) there have been three different reactions to globalization: treating it as an opportunity, devising means to survive it, and generating alternatives. These reactions can be found in all regions but Ikeda argues that there is a geography of reactions where one or other tends to dominate. This geography of reactions is similar to our relational geography: in Latin America there have been strong tendencies towards political resistance to globalisation in contrast to opportunistic reactions in many Asian cities, while African cities are part of survival strategies that look towards Asian opportunism. The UNDP’s (2003, 2004) advocating South-South cooperation is thus conflating both contemporary complex political geographies and contemporary complex economic geographies into a simple 1970s ‘single line’ world geography. Does this matter? The disjuncture between UNDP’s guardian territorial thinking and our relational geographies can be dysfunctional for the former. Our results show that “Global South’ is a geographical chaotic conception, it just does not hang together as a coherent spatial concept. Through looking backwards to the 1970s, the UN and its institutions are premising policy on a geography long swept away by the massive economic developments through Pacific Asian cities of the last three decades. So long leaders in the field of failed development policy, the UNDP is skirting with the danger of being left on the political geography sidelines while ‘real, existing’ economic development proceeds regardless, through the new relational geography portrayed above.
REFERENCESBraveboy-Wagner, J A (2003) The Foreign Policy of the Global South. Boulder, CO: Lynne Rienner Castells, M (1996) The Rise of Network Society. Oxford: Blackwell Derudder, B., Witlox, F., 2005a. An appraisal of the use of airline data in assessing the world city network: a research note on data. Urban Studies 42 (13), 2371-2388 . Derudder, B., Witlox, F., 2005b. On the use of inadequate airline data in mappings of a global urban system.Journal of Air Transport Management 11 (4), 231-237. Ikeda, S (2004) “Zonal Structure and Trajectories of Canada, Mexico, Australia, and Norway under Neoliberal Globalization,” in Marjorie Griffin Cohen and Stephen Clarkson, eds. Governing under Stress: Middle Powers and the Challenge of Globalization. London & New York: Zed Books, 263-290. Independent Commission on International Development Issues (1980) North-South: a Programme for Survival. London: Pan Jacobs, J (1984) Cities and the Wealth of Nations. New York: Vintage Jacobs, J (1992) Systems of Survival. New York: Vintage Jacobs, J (2000) The Nature of Economies. New York: Vintage Lewis, M W and Wigen, K E (1997) The Myth of Continents. Berkeley, CA: University of California Press Miller, W.H., 1999. Airlines take to the internet. Industry Week 248 (15), 130-134. OAG WORLDGUIDE LIMITED (2005) OAG Flight Guide 2005, Dunstable ( UK): OAG Worldguide Limited. Peritore, N P (1999) Third World Environmentalism: Case Studies from the Global South. Gainsville, FL: University Press of Florida REED TRAVEL GROUP (1970) ABC World Airways Guide 1970, Dunstable ( UK): Reed Travel Group. REED TRAVEL GROUP (1991): ABC World Airways Guide 1991, Dunstable ( UK): Reed Travel Group. Rigg, J (2007) An Everyday Geography of the Global South. London: Routledge Rossi, E.C., Beaverstock, J.V., Taylor, P.J. (2006) ‘Transaction links through cities: ‘decision cities’ and ‘service cities’ in outsourcing by leading Brazilian firms’ Geoforum, in press Soederberg, S (2005) The Politics of the New International Financial Architecture: Reimposing Neoliberal Domination in the Global South. London: Zed Books Taylor , P J (2004) World City Network: a Global Urban Analysis. London: Routledge Taylor, P J (2006a) ‘Development as a “monstrous hybrid”: an essay on the primacy of cities in the expansion of economic life’ Environment and Planning A 38 Taylor, P J (2006b) ‘Problematizing city/state relations: towards a geohistorical understanding of contemporary globalization’ GaWC Research Bulletin No. 197 Tolosa, H. (2003) ‘The Rio/Sao Paulo Extended Metropolitan Region: A quest for global integration’, The Annals of Regional Science, 37, 479-500 UNDP (2003) Forging a Global South: 25years after the Buenos Aires Conference on Technical Cooperation among Developing Countries. New York: United Nations Development Programme UNDP (2004) Forging a Global South: UN Day for South-South Cooperation. New York: United Nations Development Programm
Table 1 Cities, Countries and World Regions
Table 2 Largest intra-country flows
Table 3 Largest intra-regional flows (excluding flows between cities in the same country – see Table 2)
Table 4(a) Largest intra-regional flows between Pacific Asian cities
Table 4(b) Largest adjacent inter-regional flows (excluding flows between East Asian and South East Asian cities)
Table 5 Largest non-adjacent regional flows
FiguresFigure 1a Flight Patterns, 1970
Figure 1b Flight Patterns, 1991
Figure 1c Flight Patterns, 2005
(Cities are identified by their IOTA codes: Bangalore (BLR), Bangkok (BKK), Beijing (BJS), Beirut (BEI), Bogotá (BOG), Buenos Aires (EZE), Cairo (CAI), Calcutta (CCL), Cape Town (CPT), Caracas (CCS), Casablanca (CAS), Chennai (MAA), Guangzhou (CAN), Ho Chi Minh City (SGN), Hong Kong (HKG), Jakarta (JKT), Johannesburg (JHB), Karachi (KHI), Kuala Lumpur (KUL), Lagos (LOS), Lima (LIM), Manila (MNL), Mexico City (MEX). Montevideo (MVD), Nairobi (NBO), New Delhi (DEL), Quito (UIO), Rioo de Janeiro (RIO), Santiago (SCL), São Paulo (SAO), Seoul (SEL), Shanghai (SHA), Singapore (SIN), Taipei (TPE).
NOTES*Peter J. Taylor, Department of Geography Loughborough University, Loughborough, LE11 3TU, UK p.j.taylor@lboro.ac.uk Ben Derudder, Geography Department, Ghent University Krijgslaan 281/S8, B9000 Gent, BELGIUM ben.derudder@ugent.be Cándida Gago García, Departamento de Análisis Geográfico Regional y Geografía Física. Facultad Geografía e Historia. Ciudad Universitaria. Universidad Complutense de Madrid, 28040. Madrid, SPAIN cgago@ghis.ucm.es Frank Witlox, Geography Department, Ghent University Krijgslaan 281/S8, B9000 Gent, BELGIUM frank.witlox@ugent.be
1. They are members of the roster of 123 cities used in numerous analyses in Taylor (2004) and defined as cities with at least one fifth of the global network connectivity of the most connected city, London. These connectivities are derived from the office networks of firms providing advanced producer services, for further information see Taylor (2004). 2. Using a GDS-based database therefore implies that bookings made directly with an airline are excluded from the system and therefore the data. However, in 1999, just two years prior to our data, 80% of all reservations continued to be made through GDS (Miller, 1999). Thus, although our information source may give a slightly biased picture of airline connections, there is no reason to assume that the overall pattern of reservations made by direct bookings differs fundamentally from that for reservations made through a GDS. Edited and posted on the web on 24th October 2006
Note: This Research Bulletin has been published in Geography Compass, 3 (2), (2009), 836-855 |
|||||||||||||||||||||||||||||||||||||||||||||||||||||||||||||||||||||||||||||||||||||||||||||||||||||||||||||||||||||||||||||||||||||||||||