GaWC Research Bulletin 205 |
|
|
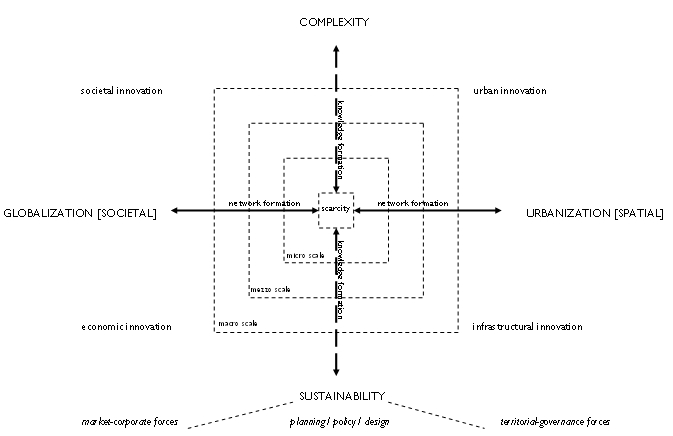
Scarcity and city-firm networksCities and their networks form the greatest of human achievements and are incrementally built up over time, reflecting human progression in which scarcity is continuously challenged by means of societal and technological innovations. Ever since the Industrial Revolution, technological innovation and social reform have been paramount to global economic development, supplying our needs and creating new forms of demand, without which the system would certainly collapse. Shifting scarcity has led to a type of progression that is suspended between the co-evolutionary processes of globalization and urbanization, reflecting the symbiotic development of firms and cities and the networks which connect them. These processes have dramatically altered the relationship of humans and the environment in various ways, such as worldwide spatial exploitation, global integration, and environmental degradation. Progression has led to an increase in complexity and the unequal distribution of technology, capital and labour - across different economic and political boundaries. From this a new form of society has been manufactured, that according to Ulrich Beck1 is ‘distinct from earlier phases of global progression’ and which requires a paradigmatic shift in how we perceive and engage with the world. Pivotal to this will be the re-conception of sustainability and the development of appropriate policies and interventions. Similarly, an effective paradigm may be needed, in which urban planning and architecture can evolve and be relieved of their current deadlock. Nevertheless, caution should be taken in pursuing grand endeavors, whereby this research serves merely as a modest contribution. Today, cities are increasingly interdependent and affected by societal and market changes, reflecting a highly complex urban system, which carries the obvious societal and environmental prospects and predicaments. Therefore an effective approach to urban development would be to avoid developing cities as ‘closed’ entities, but instead as integral components of an emergent world-city-network. Sustainable development should be based on an improved understanding of the current world-city-network and how it emerged as an evolving spatio-temporal system – one, that has incrementally overcome scarcity through the steady exploitation and reorganization of space. A ‘networked space’, that is increasingly limited in scope and resources and which harbours an expanding population with increasing demands. In this light, the ‘network society’ and its spatial equivalent, the ‘world-city-network’, should be viewed as fundamental to the human condition, and not the mere outcomes of recent human development - as is often popularized. Furthermore, the co-evolution between ‘globalization’ and ‘urbanization’ can be historically traced in both economic and architectonic disciplines, whereby the city’s transition as a ‘real’ and ‘conceptual’ entity can be observed, from simple models to today’s highly complex urban systems2. These transitions reflect the perpetual interaction between the ‘self-organising’ processes of an emerging world-city-network, and the ‘planned’ often utopian urban concepts of a transitory network society - reflecting the ancient struggle between economic production and societal wellbeing. The metamorphosis of city-firm networks appears to coincide with the intensification of scarcity, as a physical means of supplying shifting demand. Hence, a ‘circular causality’ exists, where firms produce cities, and cities produce firms – and both produce networks. A city’s performance is thus a measure of the magnitude, distribution and quality of its business relations to other cities – and how this corresponds to the wellbeing of its people. Therefore, to improve performance, a city must develop its urban functions according to knowledge of its relative position within the world-city-network. However, although much is known about the internal properties of cities, little is known about their external city-firm relationships and their impact on the environment. Because city business relations are exceedingly beyond city borders, an understanding of connectivity becomes vital to a clearer conception of sustainability. Knowledge of a city’s economic footprint can benefit future sustainability, from which the social and environmental impact on itself, and the cities it depends on, may be derived – forming essential knowledge for future investments and business relations. Understanding market complexity, as a corporate ‘network footprint’, and how this coincides with the needs of local populations should elucidate which urban functions or linkages should be improved or strengthened. Therefore, hypothetically speaking, an important step forward in the spatial disciplines, will be an improved understanding of sustainability as [1] the complex formation of network relationships between firms and cities (corporate market) across different spatio-temporal scales – and [2] how this coincides with the social, economic, and environmental performances (territorial governance) of these cities. Hence, we need to transcend the older models of sustainability, that traditionally focus on local units of spatial improvement - whereby an understanding of a city’s network relationships may contribute to the advanced programming, planning and design of the socio-economic functions within the city. By integrating spatio-economic knowledge and architectonic vision, architects and urban designers, may someday become effective intermediaries between market and territorial interests – based on a sophisticated understanding of the world in which we operate. Judging today’s generally inadequate urban developments3, proliferating junk-space4, socio-environmental discrepancies, and the degradation of the design professions - it appears that a ‘bigger picture’ and ‘grander narrative’ is more needed than ever before5. Sustainability and city-firm networksThe concept of sustainability originates around the start of the Industrial Revolution, possibly with the ‘Principle of Population’, by political economist Thomas Malthus (1798). In this period, city-firm networks flourished, gradually progressing towards our current phase of globalization, which is economically and environmentally more interconnected than ever before6. The concept of sustainability appears to reform itself around phases of world economic recession, slowly reinforcing towards full-scale economic depression - such as during the 1930s Great Depression and the OPEC oil crisis of the 1970s7. Since 1800, there have been five ‘long-wave’ (50 year) economic cycles8 , and today our network society is descending into the fifth wave’s recession, once again requiring a more suitable concept of sustainability. To contribute to this, we posit a redefinition of sustainability, structured around the previously defined hypothesis, and the provided scheme (figure 1), where it is argued that sustainability is a ‘normative’ concept, developing over time, and intertwined between the processes of globalization (societal integration) and urbanization (spatial integration). These processes have incrementally generated an increase of complexity (social and environmental impact), primarily driven by profit maximization and capital accumulation.
Figure 1: Sustainability model
PhD work – R Wall, mentor Dr. G.A. v.d. Knaap.
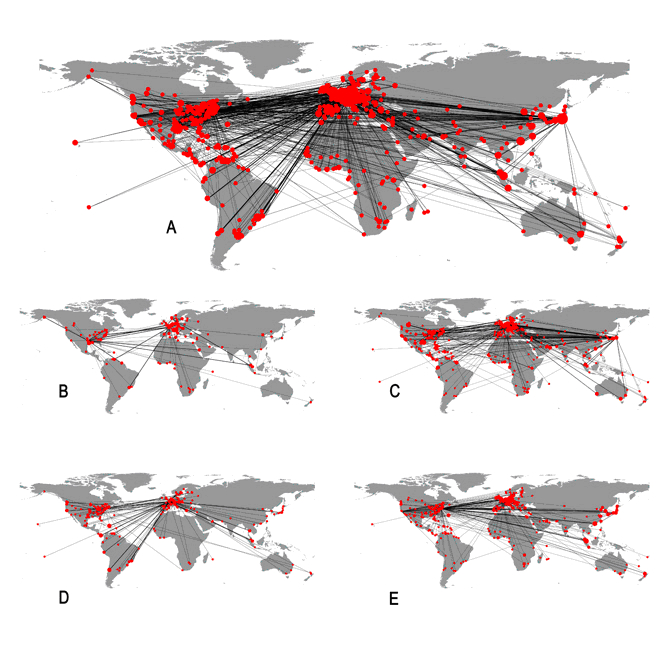
At the heart of the scheme, we find the phenomenon of scarcity, in which the struggle between demand and supply is progressively overcome and regenerated by ‘network formation’ and ‘knowledge formation’, both suspended between the processes of globalization and urbanization. ‘Globalization’, in turn, consists of ‘societal innovation’ and ‘economic innovation’ and the primary intermediary between these is the ‘the firm’. Conversely, ‘urbanization’ consists of ‘infrastructural innovation’ and ‘urban innovation’, where the former addresses physical connectivity between cities and the latter targets spatial development within cities. Furthermore, the overcoming of scarcity coincides with an increased ‘jumping of scales’, in which complexity is firmly embedded in the form of societal and environmental problems, leading to overall uncertainty within the system. In turn, complexity and uncertainty serve as vital sources for socio-economic innovation and the continuity of globalization and urbanization9 . In reality, complexity is perpetually challenged by corporate and political forces, either in the act of self-interest, or through collective-interests. Sustainability, as a normative action is a reactionary force to complexity, seeking conscious optimizations between market and territorial values, and is similarly subjected to increases in scale over time10 . Multinationals and corporate networksAs discussed earlier, this research aims to investigate sustainability as a corollary between city-firm networks (corporate network footprint) and social, economic and ecological indicators (city properties). For example, within a global-city like New York, one would discover high sustainability levels. However, its overall success depends on its innumerable business relations to other cities, at all spatial scales – where conversely a regional type city like Rotterdam would be less connected. Therefore, by analysing the city-firm connectivity of cities at different scales, we can determine: (1) the overall spatial and organizational structure of their networks; (2) the connectivity levels of each city within the network; (3) the share and spatial extent of the connections; (4) the economic functions of and between cities; and (5) which cities are more competitors or collaborators. Correlating these results with the environmental indicators of each city, e.g. city-GDP, education levels, spatial density, or architectural proliferation - we can obtain insight into the strengths of the relationships. Based on this, a sophisticated environmental-tax model may someday be possible, in which tradeoffs between cities or firms could be determined. Alternatively, we could determine which improvements need to be made, within or between cities, so as to strengthen their sustainability levels - form follows function follows flow! For now, we present a few tentative results. To start,multinational corporations are pivotal to this research, because they represent the status-quo of a long historical process of corporate development - playing a fundamental role in the formation of our network society, and the production of its cities. Today, their impact on economies and cities is more important than ever11. Furthermore, at each scale of analysis, only the top 100 multinationals were researched because they represent 60% of the total revenue of all 500 firms listed. From this, the intra-firm networks, economic sectors12 , and city locations of these top 100 multinationals and their affiliates were collected for analysis. Networks at the macro scaleAn analysis of city-firm connectivity (map 1) reveals the core network of our corporate world, upon which regional and local systems are dependent. In this network, 60% of the connections are in the information sector (the fifth economic cycle), marking a fundamental difference of this phase to previous phases of globalization. In the maps, three core regions (US, EU and SE Asia) are seen. Besides scale increase, we also see that variations in economic modes define core, semi-peripheral and peripheral relations13 . Interesting is that the more globally connected these regions are, the stronger their regional connectivity is, indicating that contrary to popular belief, the world is not flattening14 , but is in fact becoming more polarized. So, although cheaper transportation and IT networks make us perceive a ‘shrinking’ world, ‘real distance’ still matters – and it certainly matters who your neighbours are. Therefore, improving local and regional development, but within a global conception, becomes exceedingly important!
Map 1: Global city-firm networks PhD work – R Wall, mentor Dr. G.A. v.d. Knaap. A = total connections.
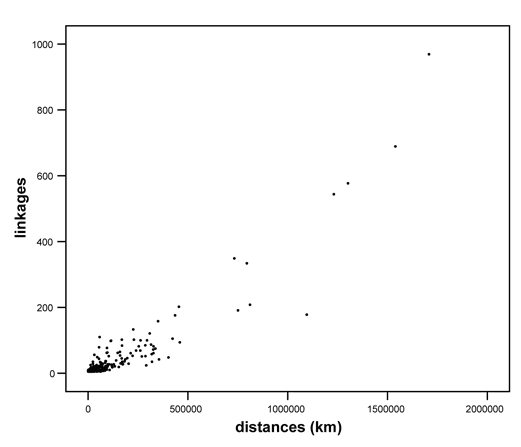
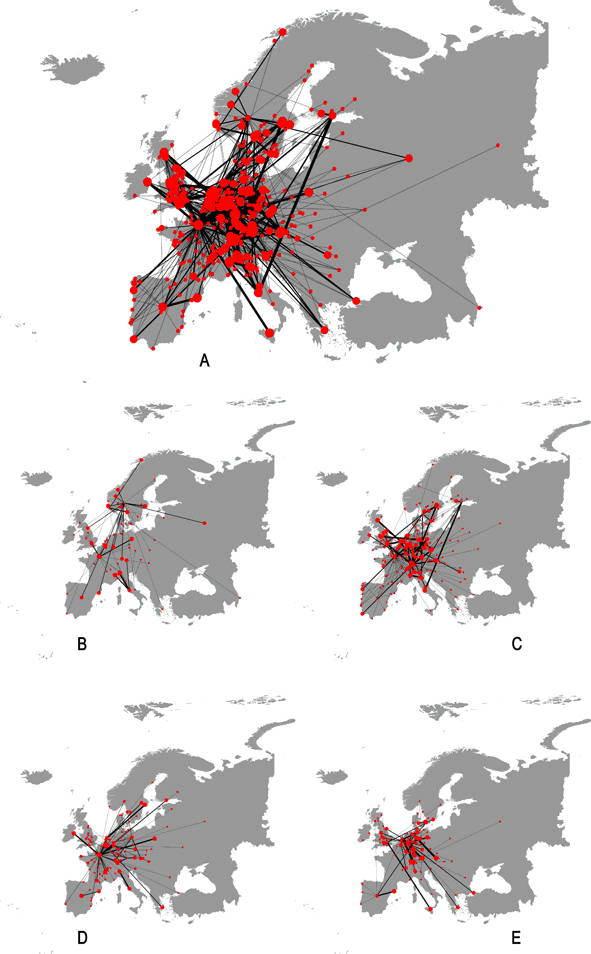
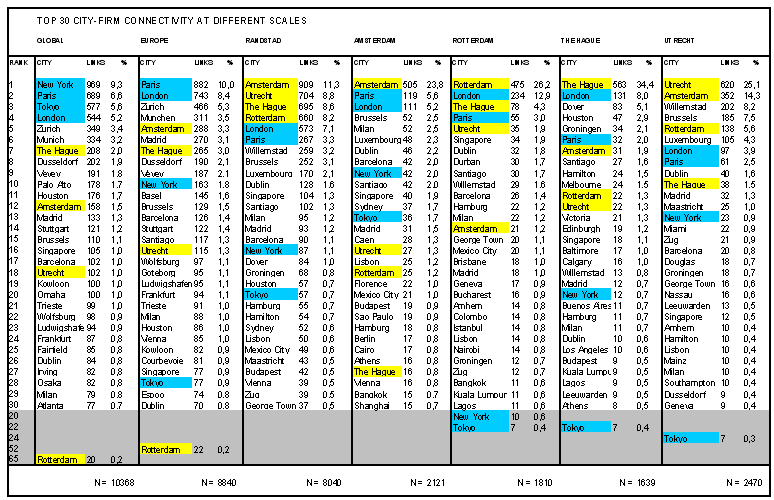
In the results, (tables 1 and 2), the top ranks are occupied by New York, Paris, Tokyo and London, together accounting for one-third of all global corporate activity. The strength of each is such, that the aggregate connectivity of the Randstad cities does not match them! New York is still the most connected city in the world15 . Furthermore, Houston’s hierarchic strength underlines our incessant dependence on oil. In the graph (figure 2), a strong correlation exists between connectivity and aggregate distances, indicating a strong relationship between a city’s connectivity and its spatial reach. Secondly, the top dots represent New York, Paris, Tokyo and London, each holding extremely disproportionate shares of connections, mirroring global inequality. Thirdly, the dense cluster of dots indicates that most cities are not globally significant, and instead operate more at a regional or local scale. Figure 2: Total city-firm linkages versus total distances PhD work – R Wall, mentor Dr. G.A. v.d. Knaap. Looking deeper, (table 1 and 2) we see for instance that New York’s strongest connections are to Atlanta, Paris, Zurich and Tokyo - primarily in the information sector, which represents 80% of its total linkages. In a global context, The Hague and Amsterdam rank as secondary cities, where Amsterdam predominates in information, and The Hague in goods - due to Shell’s presence there and its strong connections to Houston. Utrecht proves to be primarily a banking city with strong relations to Brussels, Luxembourg, Amsterdam and offshore banking with Willemstad, Curacao . Rotterdam shows low global connectivity, depicting a tertiary type city that generally operates at the regional scale. Its strengths are with New York, London, Amsterdam and Munich, especially in manufacturing, and not trade as one would imagine. Its strength in trade relates more to lower spatial scales. Lastly, the share of connectivity ‘within’ cities is low - indicating that at this scale, inter-city connectivity is more imperative to the global economy than inner-city relations. Networks at the mezzo scaleAt the European scale, (map 2), the biggest share of connectivity (60%), is held by the information sector, showing the EU’s dependence on this sector and where the strongest information cities are Paris, London, Zurich, Munich and Amsterdam. Evident is that NW Europe is the EU’s core economic region, and the once consistent ‘blue banana’, from London to Rome, has slowly dissolved into a nebulous web of cities. Paris is Europe’s primate city, followed by e.g. London, Zurich, Amsterdam and Madrid (table 1 and 2). At this scale, the importance of connectivity to non-EU cities like New York and Tokyo declines, indicating the EU’s strong supraregional interdependency. Paris’s strongest links are with New York, Santiago and Brussels, and its dominant sector is trade, while London strongly connects to Kowloon, Paris, Dublin and Singapore, proliferating in manufacturing and producer services. Amsterdam’s strengths are with San Jose, Brussels, Chicago and Atlanta, and its primary sector is consumer services. At this scale, Rotterdam’s importance increases, and is primarily connected to London and Munich, while the The Hague’s strengths are with Houston and Baltimore.
Map 2: European city-firm networks
PhD work – R Wall, mentor Dr. G.A. v.d. Knaap. A = total connections. Networks at the micro scaleAt a lower scale, the Randstad’s sectoral share is 60% in information and 40% in goods. Its strongest sectors are respectively, consumer services, manufacturing, trade, producer services, and lastly basic materials. The four Randstad cities share 37% of all connections between themselves, with Amsterdam taking the highest share, followed by Utrecht, The Hague, and then Rotterdam. The Randstad’s strongest external connection is to London, followed by Paris, Brussels, Luxembourg and Dublin; or internationally to Willemstad, Singapore, Santiago, and Houston. Looking at the connectivity of individual Randstad cities, we see that roughly 30% of the connections take place within the city borders. Hence, 70% of these city’s business relations are outbound, stipulating the importance of understanding higher scale relations. The Randstad’s network footprint on Europe and the world is shown (map 3), representing alternative, but equally valid images of the Randstad. However, ‘distance decay’ prevails, whereby the further away from the city, the more the connectivity exponentially drops. Amsterdam is most connected to Paris in terms of goods, but to London in terms of information linkages. In the case of Rotterdam, its strongest goods link is to London, and in information to The Hague. At a detailed level it strongest basic materials link is to Bucharest, in manufacturing to London, in trade to Singapore, in producer services to Milan, and in consumer services to The Hague. Thus, cities increasingly reveal organizationally integrated systems of spatially fragmented units! If we look at connectivity within the four Randstad cities, we see that Amsterdam claims the highest share of inner-city connections, followed by Rotterdam, The Hague, and Utrecht. Looking deeper at Rotterdam’s top 1000 firms (map 4) we see that only 30% of the firms are directly related to port industry, while 70% are city related. Therefore, it is questionable, whether Rotterdam is truly a port city? Furthermore, we also find that approximately 78% of firms cluster within the city centre and only 22% in the port. Therefore, spatially, Rotterdam reflects a compact, concentric agglomeration of strongly diversified city functions, with a less diversified, dispersed port attached to it.
Map 3: Randstad city-firm networks 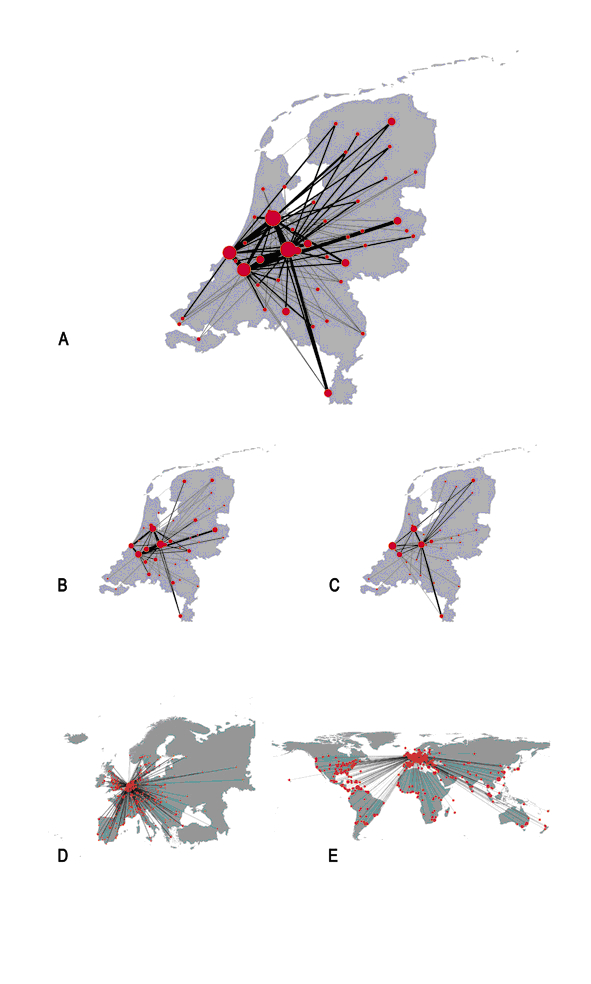
PhD work – R Wall, mentor Dr. G.A. v.d. Knaap. A = total connections.
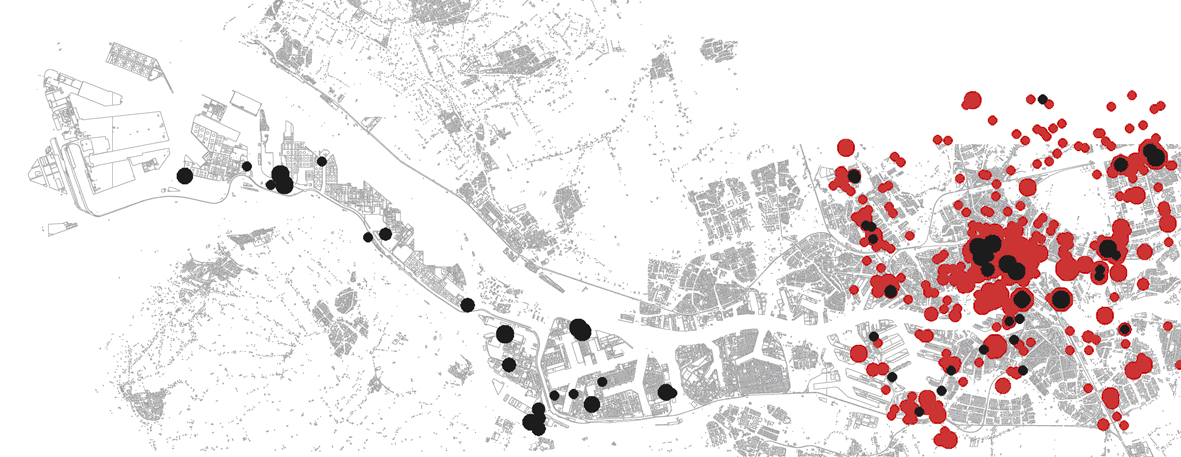
Map 4: Rotterdam’s top 1000 business agglomerations
PhD work – R Wall, mentor Dr. G.A. v.d. Knaap. A = port related firms. Networks versus urban indicatorsCloser to the crux of the matter, a few basic correlations between European connectivity and urban indicators are shown16 . Comparing connectivity to total populations in cities, we get a high correlation of 0.7, and selecting the population that is ‘employed’, the coefficient rises to 0.9 - meaning that the more connected a city is, the higher the percentage of economically active citizens. Furthermore, those employed in the information sector score better than those in the goods sector, reflecting the EU’s proclivity to information sectors. Therefore, depending on the ranking and economic profiles of cities, policies should be developed to stimulate either regional or global entrepreneurship. Investigating connectivity and education levels, we see that basic education levels score 0.6, while advanced education scores 0.9, indicating the dependency of our information society on advanced education – and that governments should seriously invest in the advanced education of their people. This is further emphasized in the fact that employees in IT hardware score merely 0.4, while those in IT services and content provision score 0.8. Looking at the number of multinational headquarters per city, versus the city-GDP, a high correlation of 0.9 is achieved; showing that the more globally represented a city is, the higher its overall economic output will be! In the case of secondary and tertiary cities, the focus may lie more in attracting and maintaining regional offices, subsidiaries and affiliates. This means that each city should specialize at the scale at which it is strongest and collaborate and compete with other cities accordingly. Lastly, a correlation between city connectivity and air-passenger arrivals, shows a score of 0.9, possibly indicating that the more corporate linkages a city has, the more business travels there will be - and presumably the more tourists it will attract. ClosureThe research is still in a preliminary phase and the final results are due much later. More analyses will be carried out, but for now only a rough sketch of our networked world has been shown. In this, the increasingly disproportionate structure found in city-firm networks, and for that matter, all natural and artificial ‘dynamic-systems’17 - challenges our conception of ‘absolute’ and ‘relative’ sustainability, and our faith in ‘even distribution’ and future forms of ‘equilibrium’. The important message in this research - is that in a globalizing world, city-firm networks play an increasingly important role in the production and performance of our cities. By eventually knowing the network footprint of cities - tradeoffs between cities and firms may someday be addressed. The empirical relationship between a city’s internal properties and its external linkages, could eventually lead to novel insights into the programming and designing of its social, economic and environmental functions. Ultimately, it could lead to a marriage between the spatial science and design professions, and a sustainability model that effectively confronts and engages with the co-evolutionary processes of globalization and urbanization.
Table 1: Connectivity ranking at different spatial scales
PhD work – R Wall, mentor Dr. G.A. v.d. Knaap.
Table 2: Strongest city links and economic sectors
PhD work – R Wall, mentor Dr. G.A. v.d. Knaap.
NOTES* Ronald Wall, Bert v.d. Knaap, Faculty of Applied Economics, Erasmus University Rotterdam 1. Beck, Ulrich (1992) Risk Society: Towards a New Modernity. London: Sage 2. An example at the beginning of the Industrial Revolution would be architect Ledoux’s ideal city model ‘Chaux’ (1804) versus economic geographer Von Thünen’s economic city model ‘The Isolated State’ (1826). Or similarly today a parallel could be drawn between certain works of AMO e.g. the ‘Prada store networks’ and Saskia Sassen’s ‘global city networks’. 3. Considering that almost half the use of fossil fuels is used in making and running buildings and the urban and rural textures that connect them, the major challenge to the architectural professions is to suggest ways of reducing humanity’s adverse impact on the planet while improving the quality of human life (Harvard Design Magazine, 2004) 4. This may lead us to counter the relative lack of reflective architecture in our profession today and the consequential production of what architect Rem Koolhaas calls ‘junkspace’ or what Luis Fernandez-Galiano calls the ‘horizontal Babel’ (Foster 2004, Harvard Design Magazine). 5. “Het zwakke punt van de traditionele grote verhalen is allerminst dat ze te groot waren, maar dat ze niet groot genoeg waren….en wat is het denken waard als het zich niet voortdurend aan de chaos zou wagen” (Peter Sloterdijk, Het kristalpaleis: Een filosofie van de globalisering, ( 2006). 6. World cities are the control centres of the global economy...They are luxurious splendid cities whose very splendour obscures the poverty on which their wealth is based. – Lilac and Flag - John Friedmann and Goetz Wolff - 1982. 7. It is around these moments that new theory and interventions are conceived such as the Club of Rome (1968); the UN Conference on the Human Environment (1972); and the Bruntland Report (1987); and reactionaries like Patrick Geddes, Christopher Alexander, and Jane Jacobs. 8. S-shaped economic cycles discovered by the Russian economist Nikolai Kondratiev (1892 – 1938). Each cycle is boosted by a new core innovation - K1 by water mechanization (1800); K2 by steam mechanization (1850); K3 by electric power (1900); K4 by Fordist mass-production (1950); and K5 by ICT (2000). 9. ‘Necessity is the mother of invention’, Plato. 10. Examples of sustainability jumps in spatial scale are Charles Chadwick’s small-scale district interventions during the first economic cycle; for the second cycle, Haussmann’s metropolitan interventions; for cycle three, Howard’s regional Garden City plans; for cycle four Wright’s national Broadacre plans; and for the fifth cycle the international plans of the Club of Rome. Towards the sixth cycle we posit the derivation of a globalnetwork sustainability plan. 11. The top two hundred multinationals in 1999 accounted for almost one third of world GDP and of the world’s 100 largest economies (multinationals plus countries), 40% are multinationals, controlling 70% of world trade (The World Bank 2000). 12. The economic sectors, in ascending order of value are basic materials, manufacturing, trade, producer services (services that support the manufacturing industry), and consumer services (services that focus on urban populations). 13. This simultaneous ‘fragmentation and integration’ process, relates to the rise in business links and destinations within and between regions - fuelled by new transportation and communication technologies, and the profit maximizing redistribution of basic material, manufacturing and services industries (see maps). 14. Thomas Friedman, The World is Flat, A Brief History Of The Twenty-first Century (2005) . 15. A position once occupied by London in the 19th century and Amsterdam in the 18th century, and where it is likely that Tokyo will become the centre of the 21st century world economy. 16. A correlation of above 0.7 indicates a very significant relationship between the variables, where 1.0 would be the maximum. 17. ‘How can systems as fundamentally different as the cell, cities and Internet, have the same architecture and obey the same laws of disproportionality (power-laws)? ; A. Barabasi and E. Bonabeau; Scale-Free Networks; Scientific American; 2003.
Edited and posted on the web on 22nd September 2006
|
||