GaWC Research Bulletin 203 |
|
|
|
This Research Bulletin has been published in a slightly reduced version, under the title 'Connectivity and City Revival', in Town & Country Planning, November 2006, 309-314. Please refer to the published version when quoting the paper.
(Parkinson et al 2006, 107)
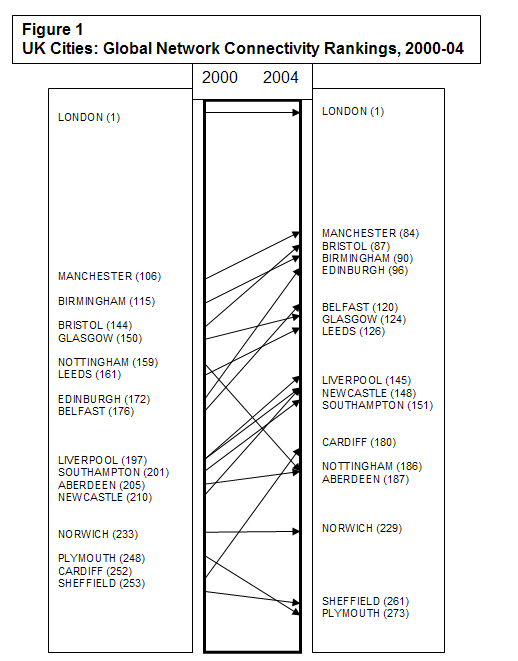
Introduction – not LondonCenturies may be only artificial social constructs of time but they do have a strong appeal for historical interpretation: note the recent plethora of books describing the distinctive characteristics of the ‘twentieth century’. But ‘centuries’ are more than ordering tools for the past, such time constructs are not inert in social change: crossing ‘landmark dates’ invites feelings of premonition, of fear of the future, but can also promote hopes for renewal. The latter appears to be the case for the UK ’s provincial cities. A simplified history would identify the nineteenth century as when these cities rivalled London for power and influence, only to be followed by a ‘bad twentieth century’ when they became a by-word for stagnation and decline. Now after decades of decline these cities beyond London appear to be making a ‘come back’ in the twenty first century. Is this mere hype or reality? Obviously it is too early to provide a definitive answer but we can begin to assemble evidence to inform the debate. In this paper we provide very specific empirics that assess how UK provincial cities are faring in the first five years of the twenty first century within a dynamic world city network (Taylor 2004). This ‘globalization’ context for understanding how the UK ’s provincial cities are faring is, of course, not a new one for these cities. In the nineteenth century they prospered precisely in the UK ’s informal (economic) imperial phase at mid-century, and began their relative decline in the UK ’s formal (political) imperialism towards the century’s end. The latter led to the rise of the ‘Home Counties’, London ’s city-region, as ‘home-base’ of the global empire. In the twentieth century, after Royal Commissions on the ‘drift to the South’ and consequent ‘regional policies’, Neil Ascherson (1988) famously noted that these provincial cities had one overwhelming characteristic in common: they were ‘not London ’. Initially, this separation from London in terms of economic dynamism was thought to have been exacerbated by the new ‘economic globalization’ towards the end of the twentieth century. From being an immensely ‘primate city’ within the UK ’s ‘national urban hierarchy’, London was transmuted into a city atop a ‘world city hierarchy’ (Friedmann 1986), one of a new rare type of city that Sassen (1991) named ‘global city’. As a sort of ‘super gateway’ for the middle zone of the globalizing world economy, London’s new success story seemed miles apart from what was happening in the UK’s other cities: they appeared to be being left even further behind. How come, therefore, the turnaround in assessment of the prospects of the UK ’s provincial cities at the turn of the new century? To answer this question we need to understand further the nature of contemporary globalization. The economic globalization we are experiencing is not an ‘end-state’, it is an on-going process of capital searching out new profit-making opportunities in the world economy (Taylor 2000). This particular phase of capitalist expansion is facilitated by communication/computer technologies that make possible large-scale geographical reorganization. But, as Sassen (1994) has emphasized, this enabling technology has contributed to both concentration and decentralization of economic activities. In other words the resulting geographies are much more complex than can be captured in simple metaphors such as ‘gateway’. In an electronic world, city gateways can be easily by-passed if that suits a particular organization (this is illustrated for Sao Paulo and Brazil , see Aranya and Taylor 2006). Thus, there has been recognition of globalization stimulating city growth beyond primate cities in several countries (e.g Mexico , see Aguilar (1999)). These ‘comebacks’ of ‘second cities’ and below are becoming a general feature of contemporary globalization. They are not simply a UK phenomenon; the process seems to be particularly marked in other European countries (Parkinson et al 2004). This has required some rethinking on how cities are conceptualised. First, the idea that globalization is privileging just a few important metropolitan areas (global cities) is being revised. All cities are part of this over-arching global process and therefore we need to be thinking in more general terms about ‘globalising cities’ (Marcus and van Kempen 2000) or ‘cities in globalization’ (Taylor 2004; Taylor et al 2006). Second, the idea that cities are inherently hierarchical in nature is challenged; historically they operate through networks; today, there is just one world city network (Taylor 2004, 2006a). Both revisions inform the debate on the nature of inter-city relation: do cities ‘compete’ or are they basically co-operative in their relations? This is an unusually complex question because cities both compete and co-operate (Begg 1999, 807). The analytical position we take here is similar to Krugman (1994): it is firms (in cities) that compete and since the firms we deal with are multi-locational across many cities, their use of cities is as networks (Taylor 2001). The result is a world city network with hierarchical tendencies, not a world city hierarchy (Taylor 2004). This is more than semantics: networks are sustained through mutualities, hierarchies through competition. In this research, our position ensures that we focus on the agents of globalization (firms); in policy circles it cautions against over-committing resources on wasteful competitive policy agendas. The argument develops in five parts. First, we review briefly recent government engagement with issues surrounding UK ’s provisional cities. In particular we critique specific evidence on connectivity provided to inform the debate between hype and reality. Second, we suggest a framework for how this debate might be informed and present a model, interlocking network analysis, which enables measurement of inter-city connectivities to be provided in evidence. Third, the project in which changes in ‘global connectivities’ from 2000 to 2004 is described; this provides for a unique glimpse at globalization trends at the inter-city level. Fourth, results on changing connectivities of UK provincial cities within the world city network are presented. The evidence suggests that overall these cities are faring relatively well through the first five years of the twenty first century. It is important to note that these results are interpreted as indicating necessary but not sufficient evidence that these cities are on the ‘come-back trail’. Finally, in a concluding discussion we reiterate our position in the light of the evidence provided. Engaging with provincial citiesThe UK is notorious for its centralization in London . And this is not just government: as Adonis and Pollard (1997, 100) described it as late as 1997: ‘the City, the West End and Westminster are the boundaries of opinion-forming Britain ’. It was from here that ‘regional policies’ were devised to deal with ‘regional problems’ through much of the twentieth century. As is the general want of states (Scott 1998; Taylor 1999), these were simple territorial policies, not functional city-region regeneration programmes. Producing regional dependencies on the state, these policies were stripped away as part of the Thatcher political revolution in the 1980s. This process was concretised in the North East region of England during a visit by Mrs Thatcher where she famously castigated the region’s politicians as ‘moaning minnies’, unwilling to promote their region to ‘stand on its own feet’. In the aftermath of the controversy surrounding this ‘political attack’, the message did get through and for about a decade everything in the region seemed to be labelled ‘Great North’. Prior to Mrs Thatcher’s visit there was just the ‘Great North Road’, subsequently there was the ‘Great North Run’ (a half-marathon), the Great North Forest, there have been the ‘Great North Swim’, the ‘Great North Walk’, the ‘Great North Toddle’ and other ‘Great Norths’, even the development agencies offices were renamed the ‘Great North House’. Promoted like a breakfast cereal, it is stories such as this one that led to the cynical assumption that talk of provincial city revival in the nineties was largely hype. Here we concentrate on engagement with provincial cities by the Labour government after 1997. The new government came to power promising devolution beyond England . Winning referendums in Scotland and Wales , some political powers were transferred from London to Edinburgh and Cardiff while at the same time the peace process in Northern Ireland promised similar powers devolving to Belfast . These three provincial cities were potentially important examples of city revival as ‘capital cities’ beyond London . But what of English provincial cities? Initially the government pursued a similar territorial devolution policy for the English regions but the overwhelming defeat of the first referendum in the North East totally derailed the policy. This is a good example of the poverty of such territorialist thinking. The idea was to begin where support for regional autonomy was supposedly most prevalent: the three northern regions of North East, North West and Yorkshire/Humberside. With no political territorial tradition there were no obvious ‘capital cities’. So where specifically would the political power be devolved to? The betting was on compromise solutions that missed the major cities: Durham (compromise location between Newcastle and Teeside), Warrington (compromise location between Liverpool and Manchester ), and Wakefield (compromise location between Leeds and Sheffield ). In other words there would not have been the potential city revival resulting from this aborted devolution compared to the capital cities in ‘national’ devolutions. In the event the overwhelming rejection of devolution by the voters of the North East did the government a big favour by forcing them to focus on their city-centred policy thinking. And it is in this context that English cities, in particular, have been subject to strong revival claims. The designation of English “Core Cities’ – Birmingham , Bristol , Leeds , Liverpool , Manchester , Newcastle , Nottingham and Sheffield – has been central to the new city-centred policy. This group of cities have come together on the premise that these big cities have a critical role in the economic growth of the country beyond London and that they can lead their respective regions into better times. They initially commissioned a report (CURDS 1999) to conclude that they were ‘a special group of cities’ with both potentials and disadvantages for carrying out their ‘key roles in the UK ’ (p. 60). However they presented evidence that the English core cities did not compare particularly well with equivalent cities in other EU countries (p.13). This is a theme that has subsequently been at the centre of core city concerns. In a parallel report for the Ministry of Environment, Transport and the Regions (Robson et al 2000), the state of English cities was contrasted with the relative successes of cities in ‘mainland Europe ’ (pp. 38-40). Both reports provide much evidence on the assets and liabilities of English cities beyond London as places, there was little or no investigation of connectivities of the cities, how cities relate to each other beyond general references to ‘city competition’. Subsequently, connectivity has come to be seen as a crucial element of the competitiveness of cities. In an Office of the Deputy Prime Minister report (Parkinson et al 2004) English cities are compared to European cities in terms of ‘urban competitiveness’, and ‘connectivity internal and external’ is identified as one of six ‘critical drivers’ (pp. 29-30). However, when the external connectivity question ‘how well connected are we?’ is asked, the answer provided uses only data on airports and internet hubs to show English cities generally lagging their European counterparts. In a related and more comprehensive survey report (Parkinson et al 2006), connectivity is part of a large schematic model of 23 elements ‘conceptualising urban competitive performance’; it is one of seven ‘key drivers of competitive economic performance’ (p. 67). However, measurement of the concept continues to be limited: train journey times to London and numbers of international flights at city airports are all that is provided (pp. 94-6) with European comparisons based upon measures of accessibility by air and rail, plus percentage of households having Internet access at home (pp. 231-3). The empirics presented in the above reports are modest in the extreme and reflect the difficulty in obtaining data on inter-city relations (Taylor 1997). Because of its availability, analysis of airline data has been the most popular means of assessing the connectivities of cities but this suffers from severe problems: it measures overall traffic not specific flows such as business class, and reflects airline hub policy suggesting more connectivity for cities where many passengers are using their airports merely for transfer. Such research has tended to be data-led and this appears to be the case with these reports. What is being measured is infra-structural connectivity, which is certainly important, but is only a partial way to look at connectivity. Following Castells (1996), infra-structural flows are just the first stratum in contemporary spaces of flows. Much more interesting is the second stratum, the spaces of flows of people carrying out their work and other activities. Castells (1996) identifies Sassen’s (1991) global cities study within this stratum. This is the conceptual starting point for the research reported below. In the second report (Parkinson et al 2006) ‘business networks’ (p. 94) are mentioned but no empirical evidence is forthcoming: the concept seems to have been subsumed within the infra-structural connectivities. In contrast, we will focus on business flows within a particular theoretical framework to create much more comprehensive measures of UK provincial city connectivities than previously provided. A Jacobsean approach to assessing city revivalsThe connectivity empirics in the reports briefly considered above are not typical of the story being told; their much more extensive place-based evidence does suggest that something new is happening in cities beyond London . Connectivity is out of step with the generally positive findings on the revival of cities. However, this may reflect the poverty of the metrics rather than connectivity actually lagging behind other indicators. A reason for this difficulty is that there is no guiding theoretical framework used that will allow assessment of whether cities are reviving or not. But just such a framework is available in the seminal work of Jane Jacobs (1970, 1984, 2000) on cities and city-regions as economic entities. Jacobs uses a simple popcorn machine analogue to describe historically how cities vary in their economic vibrancy. At any one time some corn seeds are popping in the machine while others lay dormant. The machine continues to work while the popping persists but if it stops – no corn seeds popping – the machine is no longer operating, the process has ended. Historically, in any network of cities there will be some that are vibrant and expanding while others remain stagnant. Different cities are vibrant at different times but if there are no vibrant cities, the economic expansion collapses into a mere assemblage of stagnant cities: the network of cities is no more. However, as long as one or more cities continue to be vibrant, there is a source of economic expansion that other cities can draw upon to overcome their stagnation. Vibrancy is defined as the addition of ‘new work’ to a city’s division of labour. Only new work counts as economic expansion, doing more and more ‘old work’ will increase economic size but without the ongoing diversification of the economy that is the mark of a vibrant dynamic city. Such new work and diversity derives from links to other cities, Jacobs (1970) writes about the ‘little movements’ within cities keeping the ‘large wheels’ of the encompassing economy turning. The method is perennial import replacement, new work creating alternatives for previously imported commodities forcing other dynamic cities, the erstwhile locale of exporters, to diversify further. Such a win-win situation creates the expansion of economic life through city networks. In the decline of UK provincial cities their vibrancies declined at different times – Jacobs (1970) notes that Birmingham did better than Manchester through much of the twentieth century – but the country’s only consistently vibrant dynamic city was London . In this model London is not interpreted the problem for provincial cities, on the contrary it should be viewed as part of the solution for their long-term stagnation. Operationalising Jacobs’ approach under conditions of contemporary globalization is a very large task but a start has been made through specifying a world city network (Taylor 2001, 2004). Following Sassen’s (1991) identification of the production and consumption of advanced producer services (high value-added professional, creative and financial services) as critical economic processes in her ‘global cities’, such service firms are treated as interlocking cities through their office networks. With globalization, advanced producer service firms have themselves globalised to keep their important clients, and to maintain their brand integrity. This has resulted in such firms having offices in cities all across the world; today their globality is part of their identity, it is how they recruit both new clients and the new young professionals so vital in this knowledge industry. Thus the services originally identified as archetypal ‘global city’ activities are now interpreted as archetypal world city network activities. This has been formally modelled as an interlocking network analysis (Taylor 2001). Most networks operate at just two levels; there are the individual nodes, plus their collective connections at the net level. Usually the nodes are the agents of the network formation: for instance, in a social network analysis of a gang, the individual members are the nodes whose relations define the network that is the gang. But we treat city networks as a rare and more complex type of network, an interlocking network (Knoke and Kuklinski 1982, 16). Such networks have an unusual structure of three layers: the net level (world city network), the nodal level (cities), and a sub-nodal level (advanced producer service firms). The latter are the agents in the process; it is their decisions on office locations and how they use their offices that generate world city network formation. This has been specified formally in Taylor (2001) and the basic argument is presented in the appendix. Here we describe the interlocking network analysis in general terms so that our results can be understood and interpreted. The interlocking network model is based upon the premise that multi-city service firms use their offices to enable teams of practitioners to co-operate in fulfilling the needs of their major clients. Expertise is brought together from several offices to provide the necessary knowledge to provide a complex seamless service. The interlocking network model is precisely about such intra-firm interactions. For instance, an advertising campaign in Thailand may bring together expertise from New York , Hong Kong and Bangkok . However actual data on such flows of knowledge are not publicly available, and it would take a large effort to collect such data that would probably not be possible anyway for confidentiality reasons. Therefore we use the importance of an office to derive estimates of knowledge flow between offices (cities). Thus interlocking network analysis is based upon the further premise that the quantity of information and knowledge transfer through an office is proportional to the importance of that office within the firm’s overall network. The size and functions of an office define its importance. In effect what we are saying is that the knowledge flows between two cities with large offices is much larger than flows between two cities with small offices. Quantifying such flow estimates for many service firms in a given city to all other cities where they have offices produces a measure of that city’s position within the network. In studying the world city network this position is called its global network connectivity. These measures of a city’s connectivity in the world city network can be interpreted substantively and indicatively. First, a high level of connectivity means that business in the city is ‘globally serviced’ very well; new business in the city coming from other cities will find it can be seamlessly serviced across many cities. Second, these service firms are large but by no means the largest corporations in the world economy. Nevertheless they are very good indicators of business done in a city, especially non-local business. Thus high levels of connectivity tell us that a city is well integrated into the world economy. And this comes back to the Jacobs model: vibrant cities will be well connected; stagnant cities will have relatively little connection. Thus changes in connectivity indicate whether erstwhile stagnant cities are integrating more into the world city network and thereby becoming more vibrant. The world city network change projectThe interlocking network model was initially operationalised to measure global network connectivities of cities in 2000. Details of how this was done can be found in Taylor et al (2002), only an outline is given here. Basically 100 major advanced producer service firms were identified in accountancy, advertising, banking/finance, insurance, law, and management consultancy. They were selected for their global location strategies: They had to have offices in 15 or more cities of which at least one office had to be located in each of northern America , Pacific Asia and Western Europe . In addition 315 cities across the world were selected as possible important advanced producer service centres. Using the web sites of the firms, their office networks were recorded and the different types of office noted (size, functions, etc.). Using this information, cities were coded in terms of how each firm used them; service values were allocated from 0 to 5 with the former indicating no presence of a given firm in the city, and 5 being allocated to the city housing the firm’s headquarters. In this way a service values matrix was constructed with dimensions of 100 firms x 315 cities. This matrix was subjected to an interlocking network analysis and global network connectivities were computed for all 315 cities. Of these cities, 17 were UK cities. The results confirmed concerns for UK provincial cities relative to London . Whereas the latter was ranked number 1, just above New York , there was no other UK city in the top 100. This contrasted with Germany that had seven cities in the top 100 (Beaverstock et al 2001, p. 5); in addition the second cities of other Western European countries typically made the top 100 (France/Lyons, Italy/Rome, Spain/Barcelona, The Netherlands/Rotterdam. Belgium/Antwerp). Thus this analysis strongly supported the idea that globalization was making London even more ‘primate’ relative to other UK cities. This data collection exercise has been repeated for 2004 in order to measure change in the world city network over the first five years of the twenty first century. It is results from this project that are reported below. Details of how the new research was conducted are given in Taylor and Aranya (2006). The purpose was to replicate the data collection as exactly as possible in order to produce robust measures of change. In the event, several of the original firms no longer existed and, in addition, for some firms that were still operating, the information for 2004 was not directly compatible to that for 2000. The end result is that the 100 firms have been reduced to 80 firms for which direct comparisons across the five years can be made. Therefore for 2004 global network connectivities of cities are computed from an 80 firms x 315 cities service values matrix. Results presented below are the standardised changes between 2000 and 2004 for a city’s global network connectivity. The specific way these are computed is given in the appendix. Interpretation is straightforward. Because the measures are standardised they pivot around zero and are relative scores. A negative value does not indicate absolute decline in a city’s service provision but it does show decline relative to the average of all cities. Thus the higher the change score the greater a city’s increase in relative connectivity within the world city network. UK provincial cities in a dynamic world city networkThe basic finding of interlocking network analysis for UK provincial cities in the world city network is that changes in the first five years of the twenty first century support very strongly the idea that city revivals are real rather than mere hype. Table 1 presents the evidence and it appears quite overwhelming. Out of 315 cities worldwide measured as part of the world city network, there are three UK cities in the top 10 of most positive change, 11 in the top 100, and 14 out of 17 cities are in the top half of the global distribution of changes. Obviously Edinburgh as the city with the most improved connectivity across the world stands out from the results and might be paired with Cardiff ranked 6 th for initial interpretation. Devolution has made these two cities new political capitals providing both an improved image of importance and also a new market: governments are avid consumers of advanced producer services. A similar process probably accounts also for Belfast ’s strong showing in Table 1. Bristol , ranked between the two new political capitals, is remarkable in having very high increased connectivity without a devolution boost. It can be interpreted as the spearhead of a raft of increasingly connected English provincial cities with Newcastle , Liverpool and Southampton also particularly prominent but also including what are often considered the three major English provincial cities, Birmingham , Leeds and Manchester as well. This is the point where it should emphasized that, like all relative change data, the starting point must be remembered; as we shall see, Cardiff, in particular, starts (in 2000) from a quite low connectivity level. Of course, in absolute terms most positive change has accrued to London , but, as Table 1 shows, all but 5 cities are narrowing the gap. The effects of the changes recorded in Table 1 are shown in Figure 1 in terms of changing global rankings of UK cities. Although this shows most arrows in an upward trajectory it is also a salutary reminder that UK provincial cities remain as relatively minor players in the world city network. Clearly most have become more integrated into the network with 4 cities breaking into the top 100 but still they in no way rival German cities with 6 cities scoring higher connectivities than Manchester , 5 of which are in the top 50. This is, of course, a legacy of very different national inter-city structures; London ’s traditional primacy is very clearly still in place but these results suggests there are signs of new vibrancy in the provincial cities under conditions of contemporary globalization. This European comparison can be extended by replicating the appraisal of the English core cities against ‘15 continental cities’ carried out by Parkinson et al (2004, chapter 5) but this time using our connectivity measures. This is possible because all their European cities, except for Toulouse , are among the 315 cities in our analyses. Table 2 shows the results for all 22 cities. These finding confirm that the English core cities all lag behind leading European cities like Amsterdam , Frankfurt and Barcelona in terms of connectivity for both 2000 and 2004. But in addition, the findings also show that, on the whole, the changes indicate these provincial English cities are catching up their European counterparts: only one quarter of the core cities show declining relative connectivity compared to half the continental European cities. The interpretation of this contrast is not necessary ‘national’ however. This relates to the argument that globalization is not an ‘end state’ and that global economic processes are seeking out new expansions in lesser cities. England has more than its quota of European lesser cities and therefore its cities feature prominently as increased connectivity in Table 2. Note that other cities increasing their connectivity include other lesser cities like Helsinki , Lille , Lyon , Munich , Rotterdam and Turin . Notwithstanding this interpretation, Table 2 is a rare piece of positive evidence in English-continental European comparisons. Returning to a focus at the national scale, the global network connectivities for all UK provincial cities in our study for 2000 and 2004 are shown in Table 3 . For both years, cities are placed in broad strata; this is preferred to simple ranking at the national scale. The interlocking network analysis was devised for global scale study as a ‘broad brush’ measure; thus we need to be careful when focussing on results for a limited number of cities in a single country. Viewing cities as connectivity strata made sense in a study of US cities (Taylor and Lang 2005) and it used here. Strata are identified by gaps in the sequence of measures of connectivity. Given marked differences in changes recorded in Table 1, Table 3 shows how the ordering of cities within the UK has been modified. In 2000, the strata approximated the usual way in which UK provincial cities have been interpreted: Birmingham and Manchester vie for ‘second city’ status, Glasgow is falling away from this status to be joined by a rising Bristol just behind the ‘second cities’. The remaining cities divide into 3 groups of 4, broadly reflecting variations in city vibrancy through the twentieth century. The city revivals documented above do not correlate closely with this ordering thus there is a reshuffling of city strata at the beginning of the twenty first century. Perhaps the most notable result is that the ‘second city pair’ is now a quartet due to the large connectivity gains of Bristol and Edinburgh . Glasgow is now joined by Belfast and Leeds in the strata below the ‘second cities’. Strata IV is composed of cities with relatively low connectivities in 2000 who have made marked gains, notable Cardiff and Newcastle . Other cities have remained in the bottom strata except for Nottingham , the only city to drop down a stratum. There is some debate about exactly how dynamic the world city network can be over only a five-year period, with doubts cast on the extreme fluidity suggested by Friedmann (1995) and Castells (1996) (Taylor and Aranya 2006). However, in the corner of the world city network covered by the UK there does seem to have been some important reordering of cities on the basis of differential city revivals. This suggests that the onset of economic globalization is not simply enhancing London ’s global importance but is also generating a new ordering of UK provincial cities through world city network formation. Conclusion – with LondonThe basic conclusion of this paper is that the evidence presented supports the argument for the economic revival of the UK ’s provincial cities. We need to be very clear on the nature of this evidence in adding our results to the debate. The first point to make is that the evidential basis of the conclusion is very large – two 315 x 80 matrices which add up to 50,240 pieces of information (service values). These data about global service firms and the consequent interlocking network analysis shows how well integrated UK cities are becoming in an emerging world city network. This integration has been shown to be growing for most UK cities. The key point is that the results indicate that the agents of world city network formation, the global service firms, are finding new opportunities for expansion of their networks in under-serviced UK cities. This is the city revival reported here. In the introduction we argued for the salience of these enhanced connectivities as indicators of the growing vibrancy of cities. However, it should noted that such network integration is a necessary but far from sufficient condition for the development of dynamic vibrant cities in the full Jacobs meaning. Linked into the ‘big wheels’, the cities still have to nourish the ‘little movements’ that generate the expansion of economic life. Nevertheless, the processes we have described are based upon actual practises of critical service firms in cities through their development of worldwide office networks; presumably the private actors in the process modelled here are themselves responding to evidence of economic vibrancy. Why else would global service firms be increasing their networks into UK provincial cities? Thus our results are ‘good news’ for these cities in their ongoing engagements with economic globalization. These results are just a start. There are two important routes forward both exemplified by the EU Interreg IIIB ‘POLYNET’ project that used the interlocking network model to estimate interactions within multi-nodal, mega-city regions (Hall and Pain 2006). First, POLYNET research showed that the methodology can be usefully applied to smaller cities (Taylor et al 2006), and we are planning to expand the South East England results of POLYNET to the whole of the UK . Second, our methods produce extensive research results that need to be supplemented by intensive research on the activities of the agents of network formation, the advanced producer firms. For instance, such intensive POLYNET research has shown a different spatial dynamic between producer services and consumer services in South East England (Pain 2006). Such contrasts between what can be called ‘net-work’ and ‘hinter-work’ are being further explored ( Taylor 2006b). In short, our results reported in this paper are a spin-off from a global research programme; the time has come to create a dedicated research programme for UK cities in a Jacobsean framework. One final point: engagement with globalization will come in many forms, will be different for every city, and will be subject to economic cycles. Our purpose in this paper has been to assess claims for economic revival. We have answered the question of how cities are faring through locating cities in different strata. This method is fit for this purpose but we must be careful in extrapolation it into other debate. The future of cities lies in networked niches not the traditional climbing of supposed city hierarchies. If we subscribe to the latter model all UK provincial cities are condemned to failure since there is no reasonable scenario where London will be ‘caught up and over-taken’. But London is there, not as a rival, but as an urban resource, a locale for new opportunities. Fortunately the world city network is not about to be constructed as multiple ‘mini-Londons’ or ‘little New Yorks ’. These global cities have global niches that cannot be endlessly replicated. But the world economy is not a ‘scaled–up British urban hierarchy’, it is much more complex and variable. And it is with the latter that Jacobsean processes create worlds of many different types of city. London is a very important different type of city to UK provincial cities; in broadest terms these cities need to work with London , and with Frankfurt , and with New York …
REFERENCESAdonis, A and Pollard S (1997) A Class Act. London : Hamish Hamilton Aguilar, A. G. (1999), ‘ Mexico City growth and regional dispersal: the expansion of largest cities and new spatial forms’, Habitat International 23, pp. 391-412. Ascherson, N (1988) Games and Shadows. London : Radius Beaverstock, J V, Hoyler, M, Pain, K and Taylor, P J (2001) Comparing London and Frankfurt as World Cities: a Relational Study of Contemporary Urban Change . London and Berlin : Anglo-German Foundation Begg, I (1999) ‘Cities and competitiveness’ Urban Studies 36, 795-809 Castells, M (1996) The Rise of Network Society. Oxford : Blackwell CURDS (1999) Core Cities: Key Centrs for Regeneration. Newcastle upon Tyne : CURDS Friedmann, J (1986) ‘The world city hypothesis’ Development and Change 17, 69-83 Friedmann, J. (1995) ‘Where we stand: a decade of world city research’. In P. L. Knox & P. J. Taylor, eds., World Cities in a World-System. Cambridge : Cambridge University Press . Hall, P and Pain, K (2006) The Polycentric Metropolis. London : Earthscan Jacobs, J (1970) The Economy of Cities. New York : Vintage Jacobs, J (1984) Cities and the Wealth of Nations. New York : Vintage Jacobs, J (2000) The Nature of Economies. New York : Vintage Knote, D and Kuklinski, J H (1982) Network Analysis. Beverly Hills , CA : Sage Krugman, P R (1995) ‘Competitiveness: a dangerous obsession’ Foreign Affairs 73 (2), 28-44 Marcuse, P. and van Kempen, R. (2000), Globalizing Cities. Oxford : Blackwell Pain, K. (2006) ‘Core-Periphery Relationships in a Global Mega-City Region - the case of London and South East England’ (Unpublished paper) Parkinson, M. Champion, T, Simmie, J, Turok, I, Crookston, M, Katz, B and Park, A (2006) State of English Cities . London : ODPM Parkinson, M., Hutchins, M., Simmie, J., Clark, G. and Herdonk H. (2004), Competitive European cities: where do the Core Cities stand? London : ODPM. Robson, B, Parkinson, M, Boddy, M, and Maclennan, D (2000) The State of English Cities. London : DETR Rossi, E and Taylor, P J (2006) ‘“Gateway cities” in economic
Sassen, S (1991) The Global City. Princeton , NJ : Princeton University Press Sassen, S. (1994), Cities in a World Economy. Thousand Oaks , CA : Pine Forge Scott, J C (1997) Seeing like a State. New Haven , CN: Yale University Press Taylor , P J (1997) ‘ Hierarchical tendencies amongst world cities’ Cities 14, 323-32 Taylor, P J (1999) ‘Places, spaces and Macy's: place-space tensions in the political geography of modernities’, Progress in Human Geography23, 7-26 Taylor, P J (2000) ‘”Izations” of the world: Americanization, modernization and globalization’ in C Hay and D Marsh (eds) Demystifying Globalization. London : Macmillan, pp. 49-70 Taylor, P. J. (2001) Specification of the world city network. Geographical Analysis 33, pp. 181-94. Taylor, P. J. (2004) World City Network – A Global Urban Analysis . London : Routledge. Taylor, P. J. (2006a) ‘A lineage for contemporary inter-city studies’in P J Taylor, P Saey, B, Derudder and F Witlox (eds) Cities in Globalization: Practices, Policies and Theories . London : Routledge Taylor . P J (2006b) ‘Cities within spaces of flows: Theses for a materialist understanding of the external relations of cities’ in P J Taylor, P Saey, B, Derudder and F Witlox (eds) Cities in Globalization: Practices, Policies and Theories . London : Routledge Taylor, P J and Aranya, R (2006) ‘A Global ‘Urban Roller Coaster’? Connectivity Changes in the World City Network, 2000-04’ GaWC Research Bulletin No. 192 Taylor , P. J., Catalano, G. and Walker , D. R. F. (2002) ‘Measurement of the world city network’, Urban Studies 39, pp. 2367-76. Taylor , P J, Derudder, B, Saey, P and Witlox, F (eds) (2006) Cities in Globalization. London : Routledge Taylor , P., Evans, D. and Pain, K. (2006) ‘Application of the Inter-Locking Network Model to Mega City-Regions: Measuring Polycentricity within and beyond City-regions’ GaWC Research Bulletin No 201 Taylor P J and Lang R (2005) ‘ U.S. Cities in the “ World City Network”’ Survey Series ( Washington , DC : The Brookings Institution)
Appendix-Specifying global network connectivity(for more details see Taylor (2001) A universe of m advanced producer service firms located in n cities is defined. The service value of a firm j in city i is defined as the importance of its office in the city within its office network and is represented by vij. An n x m array of all service values defines the service value matrix V. From the service value matrix V, the elemental relation is defined as rab, j = vaj . vbj (1)
This is an elemental interlock between city a and city b in terms of firm j. The underlying premise for this measures is that the larger and more important an office (its service value), the more business it does resulting in more flows of information, instruction, knowledge, direction, plans, advice, strategic guides, and people between offices. Therefore equation (1) specifies that there will be less flow in the office network between two small offices than between two large offices. Moving on to the city-scale, aggregate city interlock can be defined as rab = ∑ rab, j (2)
Each city can have up to n - 1 such links i.e. one to all the other cities in the matrix. The overall relational status of each city within the network can thus be defined as: Na = ∑ rai (where a~ I) (3) Na is the global network connectivity for the city a. To ease interpretation (because Na will vary with size of matrix) the proportion to highest connectivity is defined as: Pa = (Na / Nh ) (4)
where Nh is the highest network connectivity recorded in the network. This is the result most commonly reported in interlocking network analysis. Measuring connectivity change between 2000 and 2004(for more details see Taylor and Aranya (2006) To measure a city’s change in connectivity between 2000 and 2004 we return to the original measure of connectivity (Na in equation 3) because the proportionate measure (Pa in equation 4) is a closed number system which limits change possibilities. But because the sizes of matrices have changed (there is more connectivity in the 2000 matrix because there are more firms), we standardised connectivity for both 2000 and 2004 as follows: Sa = (Na - Ni) / α N ) (5) where Ni = ∑ Ni / n and αN = √ ( ∑ (Ni - Ni ) ² / n) This produces an open number sequence pivoting on zero.
Change in connectivity is first measured by: Ca = Sa (2004) - Sa (2000) (6)
The change measure is further standardised to obtain standardised change in connectivity which is defined as:
Za = (Ca - Ci)/ α C ) (7) where Ci = ∑Ci / n-1 and α C = √ ( ∑ (Ci - Ci )² / n) It is Za measures that are reported on above.
Table 1: UK Cities: Global Network Connectivity Change 2000-04
Table 2: Global connectivity and connectivity change 2000-04 for selected European cities
Table 3: UK cities: global network connectivities, 2000 and 2004
Edited and posted on the web on 22nd August 2006
Note: This Research Bulletin has been published in a slightly reduced version, under the title 'Connectivity and City Revival', in Town & Country Planning, November 2006, 309-314 |
|||||||||||||||||||||||||||||||||