GaWC Research Bulletin 195 |
|
|
IntroductionThis paper is divided into four parts. In part 1 the advertising industry is introduced as part of the growth of advanced producer services that have facilitated contemporary economic globalization. The origins of the industry are traced to the rise of US consumer capitalism in the first half of the twentieth century and its subsequent spread as ‘Americanisation’ in the second half of the century, culminating in ‘global’ advertising by the end of the century. In part 2, the industry is represented by the top 50 advertising firms in the world, as described in Advertising Age Annual Reports. This source provides aggregate data on billings and commission rates over time and space and corporate concentration. Both cyclical and linear changes are found. By the end of the period there are just three companies dominating the industry. Part 3 focuses on one of these ‘mega firms’, the Omnicom Group. Using the company’s Annual Reports, trends in the distribution of revenues between five main expenditures are described: salaries, office costs, interest payments, taxes, and profits. They show a privileging (protecting from both cyclical change and linear decline) of two elements of the accounts: labour and profits. In a short concluding part, this finding is interpreted within the overall context of the previous analyses: it relates to the peculiar nature of advertising as a high value knowledge industry. PART 1 ADVERTISING AS A LEADING INDUSTRY IN THE WORLD-ECONOMY SINCE 1990This part of the argument does three things. First, it justifies starting the analysis in 1990 through treating advertising as a component of the global rise of advanced producer services. Second, it justifies treating advertising as a leading edge industry by linking it to the ‘consumer capitalism’ of American hegemony, culminating in its contemporary role as economic ‘weather vain’. Third, some specific characteristics of the advertising industry are introduced as an aid to subsequent analysis and interpretation. Globalization and Services: The Final Up-scaling in the Late Twentieth CenturyThe second half of the twentieth century has been marked by the rise of the ‘service sector’ in leading economies across the world (Daniels 1993; Dicken 2003). Whether measured by value created or labour employed, services have outstripped combined agriculture and manufacturing activity, typically in a ratio of about 2 to 1. Hence it is sometimes said that we are live in a ‘service economy’. But the statistics behind such specification is partly the result of weak conceptualisation. For the people who devised ways of dividing up the economy for measuring sector contributions in the late nineteenth century, ‘services’ was the left over sector; they were basically interested in monitoring manufacturing superseding agriculture as the most important sector. Thus today, ‘services’ is a catchall term that covers all manner of production of intangible commodities, from health services to retail services and much, much more. The gross variety in the economic natures of services compared to the other two sectors has led to the term being identified as a classic ‘chaotic conception’, a concept more likely to obfuscate than to explicate (Sayer 1992). ‘Services’ are not a single economic sector, they are several sectors: allocating the activities of street cleaner and investment banker to the same economic category makes no taxonomic sense. The idea of a service economy cannot be sustained through suspect statistical categories but it can still be a useful concept for describing the combined outcome of three key economic movements of the twentieth century. First, the rise of the welfare state meant the massive expansion of public services that contemporary neo-liberalism is finding difficult to reduce. Second, the rise of consumer society meant a massive expansion in private services, personal and retail as we learn to shop as recreation. Third, with globalisation (sometimes viewed as ‘the rise of global society’), there has been a growth in the strategic services that facilitate global capital operating worldwide in a uniquely integrated manner. These latter are termed advanced producer services, consisting of professional, creative and financial services for business, so expert they have to be outsourced Sassen 1991/2001; Daniels 1993). The commodity they sell is customised specialist knowledge: they are commonly referred to as ‘the knowledge industry’. Without these services there could be no economic globalization. Business services are as old as business and therefore many advanced producer services are older than the modern world-system - maritime insurance, commercial (merchant’s) law, audit accountancy and some financial instruments for example. But other such services are strictly modern such as advertising and management consultancy. To provide their particular service, these firms require close relations with their clients. A successful firm builds up a client-base over time and it is this that defines the worth of the company. Thus traditionally firms have been quite local, typically single city-based. In fact firms would normally be identified by their city: a ‘ New York law firm’, a ‘Liverpool insurance company’, an ‘ Amsterdam bank’, etc. From the late nineteenth century onwards, through mergers and acquisitions and stimulated by national regulation of professions and companies, many such firms began to operate at a national scale. Varying to some degree with the physical expanse of countries, big city banks became national banks, big city insurance companies became national insurance companies, and so on. With this geographical change the firms changed, like their public service counterparts expanding at the same time, going beyond a single locality could only be coped with through bureaucratisation. Instead of being customised for a known local client, products had to become relatively standardised in a national market. Many advanced producer services were not that ‘advanced’ by the mid-twentieth century. All this changed with globalization and the final up-scaling of business services. In the 1970s two distinct advanced technologies, computers and communications, combined to create a new enabling infrastructure for global organisation. As it became more pervasive and sophisticated, this global infrastructure was able to provide a semblance of the immediacy of the original city business service for transnational service activities: the loss of old relations based upon contiguity replicated by new relations based upon simultaneity (Castells 1996). Thus up-scaling to the global would not mean simply building bigger bureaucracies than existing national firms, advanced producer services could enhance their being as expert, customised service providers, but now at a global scale. Of course, there was nothing inevitable about this up-scaling, economic circumstances had to be right. The possibilities of this infrastructure were first exploited by large multinational corporations creating the new international division of labour – commodity production in the ‘third world’, command functions and product development in the ‘first world’. However, it was these corporations who were major clients of the leading business service firms, and as the corporations became more global so also did their service needs. Hence service firms were threatened with losing important clients unless they could provide a ‘global service’. Many responded in the 1980s by creating new offices where their clients did business but this highly dependent strategy soon gave way to business service firms developing their own global locational strategies (Kim 1995; Leslie 1995, Tharp and Jeong 2001). By 1990 the thinking was: if you are going to invest in providing a transnational service it is dangerous to remain dependent on a few old clients, rather take the opportunity to gain more new clients in new markets. The resulting organisation of global service firms is a multiple location office strategy so that a ‘seamless service’ (i.e. as was once offered in a single locale) is provided across the world. These global service firms are constituted as office networks located in the ubiquitous office tower blocks of contemporary world cities (Taylor 2004). Their work generates myriad flows of information - advise, instruction on plans, designs, strategies (supplemented by air travel for face-to-face meetings as necessary) - that is the knowledge they are selling to service global capital in today’s intensely integrated world-economy. This knowledge behind expert services includes multiple inter-jurisdictional law, financial instruments in 24-hour money markets, global advertising campaigns, multiple tax jurisdiction accountancy, investment banking advise on multinational acquisitions, and numerous management consultancy activities. Thus have advanced producer services come to be a critical cutting edge economic sector in globalization since 1990. Americanization and Advertising: The Leading Industry of Consumer ModernityWithin advanced producer services, advertising has become a key facilitator in contemporary globalization (Bagchi-Sen and Sen 1997). The industry has been fuelled by ever-increasing consumer expenditure that relies on advertising to develop, sustain, and spread markets for the products of capitalism. It is through the success of advertising campaigns that capital is realised globally. This ‘global consumer world’ is a projection of a consumerism that was largely pioneered in US society in the first half of the last century – many of the features that today we identify as globalization (e.g. ‘global brands’) were originally experienced transnationally as ‘Americanization’ in the mid-twentieth century. The modern advertising industry was both a creator of, and created by, this original US mass consumerism and advertising continues to be the archetypal American advanced producer service in contemporary globalization. Thus advertising is a relatively new producer service and this is crucial to its selection here. It was a central player in the creation of a new framework for capitalism that we call American hegemony. With US advances in manufacturing building upon British industrial hegemony to create new mass production, a need was generated for a complementary mass consumption. The advertising industry developed in the 1920s to meet this need ‘to speed the flow of goods through the national market place’ (Marchand 1986, 2). This was the ‘American speciality’ industry (Mayer 1991, xv) that created a ‘consumer modernity’ as the cultural face of American hegemony ( Taylor 1999). Advertisers were the arch agents of this new modernity, the promoters of new fashions and ideas in the ‘new American tempo’ (Marchand 1986, 4): ‘they brought the good news about progress’ (p.1). Today, no longer so American-dominated but still ‘selling modernity’, advertising’s contemporary role can be seen as speeding the flow of goods through the global world market. But this is a naïve interpretation of advertising. Although the industry would peddle itself as the consumer’s ‘ambassador’ providing information on goods to buy, in reality advertising practitioners operated as ‘consumption engineers’ (Marchand 1986, 29). Their purpose was never simply to expand markets, they operated on behalf of their clients to create partial monopoly rents through the branding of commodities. By developing and maintaining brands, advertisers added value to products allowing their clients either to sell more at the same price or sell about the same at a higher price (Mayer 1991, xi-xii). Trademarks, like patents and copyrights, provide monopoly powers but in the former case without the time limits. Thus American hegemony has created ‘a world of brandscapes’, to extend Mayer’s (1991, 27) evocative description geographically to contemporary globalization. Initially, when US producers in the 1920s were concerned about overproduction, advertisers were hailed as ‘guardians of uninterrupted growth’ (Marchand 1986, 2), as the solution, no less, to capitalism’s propensity for disruptive economic cycles. Obviously this accolade only lasted to the next severe downturn but the 1930s in no way eclipsed advertising. By now the industry was embedded into the new social matrix that was American consumer capitalism. This is reflected today, ironically given the 1920s beliefs, in advertising’s particular sensitivity to cyclical changes. In fact this illustrates the industry’s continued centrality to modern capitalism: it is widely used as a key indicator of either signs of rise or decline both in national economies and in the world-economy. This is a particularly salient reason for the choice of advertising as a contemporary leading industry. But it is not a sufficient reason. Using an ecological analogy, an ‘indicator species’ in an ecosystem is not necessarily the ‘dominant species’, this defined as the species around which the ecosystem is organized. An example would be the tallest tree species in a forest as dominant species, with monitoring of an owl species used to judge the health of the forest ecosystem. Thus indicator species are defined as critical within the food chain but they are not the dominant species. Advertising is critical in the contemporary commodity chains of the world-economy but it is by no means the largest industry – for instance, its firms do not feature prominently in the Fortune 500. Nevertheless, as we shall see in the next section, advertising companies have been growing phenomenally in recent years. In analyses below we will focus on Advertising Age ’s top 50 firms – we will term them major firms – that dominate the world market: in 2001 they were responsible for over $360 billion sales of advertising grossing them a combined income over £42 billion. However, size alone does not qualify the industry as a ‘leading’ industry; we have to return to its role in global commodity chains: advertising keeps consumer capitalism going through good times and bad. By creating wants and converting them into needs it has stimulated a huge growth in personal debt that has sustained a massive growth of the world-economy through the 1990s, and which has been credited with the ‘soft landing’ in the early 2000s. In the contemporary period, the industry appears almost (but only almost) to be living up to its supposed power identified by its promoters in the 1920s. This is why today we can reasonably identify advertising as a leading industry for study (Monle and Johnson 1999; Coopers and Lybrand 1992). The Nature of the Advertising IndustryNachum (2000, 27) points out that advertising firms ‘are in a unique position in which there is a separation between those who buy their services and those who “consume” them’: their customers are commodity producers who pay for adverts, their ‘consumers’ are the potential commodity buyers. This ‘in-between position’ has several important ramifications that have to be understood before we analyse the global advertising industry. Three aspects of contemporary advertising require exposition before interpreting the operation of the industry is attempted: its continuing mosaic geography in production, its dual organisation structure, and its triple financial ordering. A Combined National-Global Geographical StructureAlthough with its propagation of global brands advertising appears to be the epitome of contemporary globalization, its practice is anything but ‘a world without borders’ however well known the brand. Advertising is a cultural pursuit and as such has to be mindful of cultural differences: the same product has to be presented in different ways in different national contexts (Kanso 1991; Leslie 1995; West 1996; Natchum 2000). Furthermore the main media for advertising, TV, and also press and radio, remain largely national in organization across the world (Morley and Robins 1995). Borders remain important in advertising. To provide a seamless global service for a client, an advertising firm requires a two level approach. In selected cities, usually New York, global strategy is devised with the client and most of the creative work is done. But in rolling the campaign out across the world, the product has to be adapted country by country. This requires a very nation-state based distribution of offices. Unlike other services, there is no need for ‘regional offices’ to coordinate multi-national zones – for instance, no Brussels office to run western European business because there are no ‘western European TV stations’, only French TV, German TV, etc. The Brussels office will handle TV advertising in Belgium only. Also there will be no need for multiple offices in a country: a Paris office covers French TV; a Bucharest office covers Romanian TV and so on. Thus there are offices in the ‘TV city’ (usually capital city or largest city) of countries across the world (Taylor et al 2004). Although this pattern of work is superficially similar to the new international division of labour this is emphatically not the case. All the labour is professional and creative, in the TV cities they may not have the autonomy to change the strategy but they do have the special (cultural) knowledge to adapt for a particular audience. The final production is for the local (national) market, not a singular world market, and is created using local professionals not cheap labour. Overall, production is through a combined national-global economic geography. The Organisational Structure: Holding Companies and Agencies The advertising industry is distinctive in its organisational structure. As it has grown, major transnational corporations have emerged through the usual processes of mergers and acquisitions (Ducoffe and Smith 1993; Kim 1995). However, this growth process causes problems for advertising practice because the value of a business being taken over is largely a function of its client list. But acquisitions and mergers will often bring the accounts of rival clients together into one advertising firm. Obviously advertisers cannot service clients that are in competition, but neither does it make commercial sense to choose between clients and lose a lucrative contract. The solution to this conundrum has been to create a dual-level organization structure (Banerjee 1995; Tharp and Jeong 2001). All global advertising firms operate in practice under the umbrella of ‘holding companies/groups’ (e.g. Omnicom) that constitute a collection of ‘Advertising Agencies’ (e.g. BBDO Worldwide) with ‘firewalls’ between them so that clients in competition can be serviced within the same group but by different agencies. This organizational form corresponds to the division of knowledge work: the holding companies do the strategic managerial work, and the Advertising Agencies provide the creative design producer services. The vast majority of the literature of advertising treats the agencies and their creative work. Since our concern here is not the practice of production but the economic bottom line, the focus is on the consolidated financial results of holding companies. The Financial Structure: Billings, Commissions and Profits A typical transaction in this industry involves a minimum of three firms - manufacturing, advertising and media. The basic unit of the transaction is an advert created by the advertising firm about the manufacturing firm’s product to be transmitted by the media firm. The sale to the media is recorded as the billings for the advertising company. It is commonly used as a measure of the size of advertising companies: Advertising Age ranks companies on this measure in its Annual Reports. Table 1shows the total billings for major firms from 1990 to 2001 with the annual growth rates. The latter clearly shows advertising in its ‘weather vain’ role: the reporting period covers an economic cycle starting with relative stagnation – approximately zero growth over the first 4 years, followed by and impressive boom with growth percentages in double figures before the abrupt return to near zero growth in 2001. This cycle, consistent with the general economic cycle described by Brenner 2002, defines the economic context of our study period. The conventional way in which advertising firms are paid is 15% of the billings (The Economist 1990, Natchum 2000). This is called the commission and constitutes the revenue accruing to the company. This practice can be interpreted as ensuring the integrity of the profession: competition is not reduced to the cheapest but choice is made on creative product preferences. However, like all such control of professional remuneration, it also provides a gross monopoly position for the service providers, ensuring no undercutting and therefore good profits for all work (Johnson 1972). Nevertheless, this arrangement is not always strictly adhered to and may be negotiable. In addition, holding companies bring together more than just advertising, incorporating services such as provided by PR agencies where the payment is by negotiated fee. Thus in practice the overall revenue (commission rate and fees) rate is near to 15% of billings for holding companies but there is variation. Variations in revenue rate have implications for a firm’s profitability and we consider this measure below. Billings and commissions are published for the top 50 holding companies in the Annual Reports of Advertising Age, which we use below. Billings and revenue rate define the price paid for the advertising product from which a firm’s profit rate is derived. But to compute this rate requires detailed company information on cash flows that is not available in general data like those provided by Advertising Age. However, the information is available because the holding firms are public companies; this involves going to individual company annual reports. From initial inspection of leading company reports it was found that one company, the Omnicom Group, provided the best accessible data for our time period. We will argue below that the results of this company provide a reasonable representation of the industry from 1990 and therefore discussion of profit rates will be based upon this company. Table 2 shows the cash flows through Omnicom for 2004. The first point to note is that a very large proportion of the revenue (87.5%) goes on salaries and offices: this is a knowledge industry and therefore its capital is largely human capital, the value of Omnicom is in the expertises of its personnel. In terms of cash flows, Omnicom reports a loss over the year but this accounting result does not mean the company was necessarily unprofitable. This cash figure fluctuates wildly year-by-year (e.g. 2003: +$576.5million, 2004: -$77.9million) and depends upon accountancy adjustments. The significant number in the report is the net income from its core activities since it is upon this result that payment to shareholders is made. Thus the profit rate is computed as the proportion of revenue that is recorded as net income. This is the measure used below. PART 2 BILLINGS AND REVENUE OF THE TOP 50 ADVERTISING COMPANIESThe analyses reported below are all derived from data given in the Annual Reports of Advertising Age. In the Reports up to 1990, the focus was on agencies and the US market. From the 1991 Report (there is, of course, a time-lag - it provides information for the previous year, 1990), however, the emphasis is on the top 50 ‘advertising organizations’ – holding companies – in the world. Data on city markets remains US only until the 1992 Report. Unfortunately, in 2003, the Report was reorganised focusing on the top 25 companies and eliminating city data altogether. Thus the analyses below are based upon data for the world’s top 50 companies, we will call them the ‘major firms’, from 1990 to 2001. The National-Global Geography of Advertising in the Early Twenty First CenturyPreviously we have described advertising as an ‘American’ industry with a ‘national-global’ geographical structure. In this first empirical section we illustrate the specifics of this geography at the beginning of the twenty first century thereby linking vestiges of US origin with contemporary globalization. For instance, of the 50 major firms listed by Advertising Age in 2001, headquarters were split nearly evenly between US (26) and non-US cities (24). Of the former, nine were located in New York; of the latter, 9 were located in Tokyo. Only London rivalled these two cities with its 5 headquarters. But studying one office per firm, even if it is the headquarters, will not reveal the national-global operating structure. In 2001, Advertising Age reported its fullest list of the total billings by cities. Billings made to major firms operating out of the largest advertising markets were provided in two lists, for the USA and for the rest of the world. From this data the top 40 city advertising markets in the world can be identified and they are listed in Table 3. I use the table to show the specifics of the national-global geographical structure of the industry at the beginning of the twenty first century. The advertising market is very uneven across cities but the latter are reasonable worldwide in distribution. Clearly New York dominates followed by Tokyo and then London. These are Sassen’s (2001) three global cities, the leading cities of the three main globalization regions: northern America, western Europe and Pacific Asia. Other cities are unevenly distributed among these regions; in all there 17 in northern America (all but one in the USA), 14 in western Europe, and 5 in Pacific Asia (if we include one from Australia). In addition, non-core zones are represented through Sao Paulo, Mexico City, Buenos Aires and Mumbai. Although US cities dominate the list, they constitute only 40% of the total cities and, overall, cities from 24 different countries are listed. This reflects first, the ascendancy of the US in this industry, and second, beyond the USA, the pattern of concentration in one ‘TV city’ per country (the only country outside the USA to have more than one city in Table 3 is Germany). In the US, there is a similar pattern: one ‘TV city’ per large state with California and Texas being the only exceptions. Rankings in Table 3 are largely a function of the market size of the TV area serviced from a city and the degree of penetration of the major firms. Thus there are three basic geographical conclusions: first, the continuing dominance of the USA, second, the worldwide the reach (i.e. including the ‘third world’) of global advertising through national markets, and third, the geographical concentration in the three ‘global cities’, the latter reflecting economic concentration of leading major firms headquartered in New York, Tokyo and London. Concentration Tendencies and Revenue Changes, 1990-2001Turning to changes over time, we find that despite the strong economic cyclical pattern of our study period, directly reflected in billings (Table 1), key processes in the advertising industry exhibit relatively simple trends: concentration is on the up (a monopolising trend), while commissions are in decline (a revenues squeeze). The major firms vary greatly in size with just a few dominating the market from 1990. Since the main form of growth in advertising firms has been mergers and acquisitions, these monopolising tendencies have increased over time (Kim 1995; Leslie 1995). To illustrate this major firms are divided into three rank-size categories: the top 5, other companies in the top 10 ranks, and the remaining 40 companies. Tables 4 and 5show the percentage of global advertising billings accruing to each of the three rank-size categories by year to 2001 and the resulting growth rates. The results are clear-cut. The top 5 companies gradually increase their share of the market culminating in a remarkable surge in the final two years: the end-result is movement from just below one half of total billings in 1990 to just over three-quarters in 2001. The obverse is true for the companies ranked 11 to 50 who experience gradual reduction in share of billings culminating in a precipitous fall in the final two years: the end-result is movement from a little below one third of billings to well below a mere tenth. The ‘middle group’ shows a mix of the two trends above so that there is no general trend but in the upheavals at the end of the period initial gains are abruptly reversed in the final year: the severity of the latter means that the overall result is a slight decline for the whole time period. Thus there are two basic conclusions, first, there has been a general trend towards concentration in the global advertising industry, and, second, this trend accentuated remarkably in the final years of the period covered. The latter is consequent on acquisition activity during a downturn in the advertising market. The end-result is a highly monopolising industry: a ‘big three’ mega firms has emerged - WTT, Interpublic and Omnicom - which between them were responsible for 55% of all major firm billings worldwide in 2001. The trend in commissions (Table 6 ) mirrors the billings cycle (Table 1) but over time the rise in revenue does not keep pace with the rise in billings. Thus, like the monopolising tendency, the commission rate has exhibited a relatively simple trend: Table 6 shows the major firms experienced continuous annual decline in their overall revenues throughout the period. Although the trend in degree of decline is irregular, the smallest does occur between the first two years and the largest in the final two years. The conclusion from this section is that, largely irrespective of the economic cycle, the advertising industry has concentrated its ownership as commission rates have declined. The biggest change in both time series was in the final year but we must be careful about positing a relationship in what is a geographically segmented market. Concentration and Revenue Rates Across Cities in 2001To show concentration of the top companies in the 25 largest markets (cities) I have taken the top 9 companies in 2001. This number of companies has been chosen because there is an abrupt step reduction in size of firms at this rank. These nine companies took an impressive 91.5% of total billings for all 50 companies. Going back to individual company listings reported in Advertising Age Annual Report, I have calculated the contribution of the nine companies to each city’s billings. The results in Table 7 show remarkably clear-cut results. There is a major contrast between US cities and the rest with, apart from Seoul, US cities occupying all bottom ranks for top 9 firm geographical concentration. At the other end of the scale, the top 9 companies control very high proportions of the market in many non-US cities – there are 8 where market share is above 90%. This contrast shows that the advertising industry’s prime origin in the USA is reflected in a much more complex pattern of service provision involving many firms other than the global top 9: the limited case on Table 7 is Philadelphia which is totally service by firms other than the top 9. Spatial diffusion of advertising beyond its ‘homeland’ to the rest of the world has created much simpler national advertising markets evidenced by corporate concentration. To calculate revenue rates by cities required making assumptions about company profit distributions and then considering the proportions of firm’s billings in each city. The resulting ‘estimated revenue rates’ are shown in Table 8 (for 23 cities: Philadelphia and Minneapolis are omitted for zero and low contribution by the top 9 companies). There is a remarkably low range of revenue rates reported across all cities and, unlike Table 7, US cities are distributed across the range. This suggests that the major holding companies are operating a reasonably unified world market despite the nation-global geography of service provision. However, that the global advertising market is not a perfect market can be seen in the small differences in revenue rates that indicate local structural market differences. The top and bottom of the list illustrate this. The Tokyo market is a sellers market: it is largely serviced by Japanese companies with resulting monopolistic tendencies creating high revenue rates. In contrast, the Detroit market is a buyers market: a market where a few (motor company) customers dominate to hold down revenue rates. PART 3 PROFITS IN THE DISTRIBUTION OF REVENUE: OMNICOM GROUPIn this part we interrogate the distribution of advertising revenues to finally reach profit rates after taking account of labour costs, taxes and other expenditures. This is information that is not provided in Advertising Age Annual Reports but it is reported in company annual reports. As previously noted (see Table 2) we are using Omnicom Group, one of the Big Three. The choice of this holding company is because this is the only major firm we could find that provided accessible and comparable information across our time period. This is important because it allows the revenue analysis of this one firm to be related to the previous analyses. But to be relevant the choice of firm needs to be more than a pragmatic one. Thus in the first section below Omnicom is introduced to show that it is a reasonably typical of the large holding companies that are spearheading globalization of the advertising industry. For this we continue using the Advertising Age data, abstracting information on this one firm from the total. Omnicom Group: A Global Networks FirmHeadquartered in New York, Omnicom is a typical holding company. It is made up of many different agencies and subsidiaries organised into four sections covering advertising, marketing, public relations, and speciality firms (Figure 1). Approximately three quarters of revenues derive from the advertising and marketing sections. Advertising is the biggest category and it is here that the pivotal parts of the organisation are found, the three leading agencies that provide alternative global networks for clients: BBDO, DDB and TBWA (Figure 1). The global reach of the company is shown in Table 9 where the Omnicom’s billings for the largest 40 city markets in 2001 are shown. These are the same cities featured in Table 3, and it can be seen that this firm’s geography broadly mirrors the general pattern previously described. Stronger in New York and weaker in Tokyo as expected, there are other particularities (the absence from Boston, the choice of Dusseldorf over Frankfurt to serve the German market, etc.) but, for a single company, the widespread distribution is impressive. Furthermore, the billings in Table 9 represent just under 60% of the company’s total; there are scores of other cities receiving the outstanding 40% of billings worldwide. We can conclude that Omnicom is a global networks advertising company. The basic temporal statistics for Omnicom are shown in Table 10, which relates to the general advertising data in Tables 1, 5 and 6. The company has been in the top 3 in world ranking since 1992, and was the largest advertising company in the world for the final three years of the nineties decade. For billings, Omnicom shows a similar cyclical pattern of growth to the rest of the industry except that its growth rate is always higher (Table 10, Table 1). This is what we expect for a leading company (Table 5) and it means that, unlike the industry as a whole, the company has never experienced a year of decline (Table 10, Table 1). Its slight fall in rankings in 2000 and 2001 reflect slightly less growth in these years compared to its peer competitors (Table 5). This difference relates to the nature of growth being based upon acquisitions: for instance, the 1992 high growth relates to the acquisition of the TBWA network agency. For commissions, Omnicom has a less smooth, but nevertheless discernible, decline in rates over the time period (Table 10, Table 6). For all its large size, the company has not been able to buck the trend of squeezing revenues from billings over time. We can conclude that Omnicom has behaved similar to the rest of the industry over our time period, and coupling this with the geographical comparisons, it means, therefore, that we can be treated Omnicom Group as reasonably representative leading firm of the advertising industry for subsequent analyses. Analysing Omnicom Group’s RevenuesInformation for these analyses are from company Annual Reports and the time frame is slightly different from that used previously: we can get more up to date figures (to 2004) but cannot trace back as far (only to 1993). The overlap between the two 11 year periods is large enough to make considered comparisons possible. The Reports allocate revenue to five categories: ‘salary and service costs’ (labour in subsequent discussion), ‘office and general expenses’ (office), ‘net interest expense (interest), ‘income tax’ (tax), and ‘net income’ (profit) which is paid to shareholders. These can be divided into two categories: labour and office (the means of production) constitute necessary expenditure on the production work; interest, tax and profit constitute financial annual accounting. The latter can be varied by negotiation to reschedule loans and defer taxes in order to ‘control’ the profit declared in a given year. The changing distribution of revenues across these categories is shown in Table 11. Following on from Table 2, once again the most obvious feature of this new table is the dominance of labour costs. This is entirely to be expected for a ‘knowledge industry firm’ – the intangible product requires high-cost, professional labour. The only other input to production is a well-equipped office in an expensive central city location so the professionals can interact with fellow professionals in an ‘industrial cluster’ (Madison Avenue was the classic case). Between them these production expenditures account for between 85% and 90% of revenues. There is a slight tendency for this proportion to decline over time although there is also a cyclical tendency around the turn of the century requiring proportionally less expenditure from the revenue generated. But these patterns are totally overshadowed by the contrary trends for labour and office – the former has steadily increased over the 11 years from 58% to 72%, the latter has declined from 31% to 17%. This is a massive turnaround. Quite simply, the revenues squeeze cannot be dealt with by reducing labour costs because the professionals are the company as a production unit. Hence they continue to be in a very strong position in their labour market because defections to rivals, especially if it means taking clients, has to be avoided at all costs. Therefore it is the other production costs, the office, that has to bear the brunt of the revenues squeeze and rises in labour costs. Either through negotiating new rents or moving to less expensive real estate, Omnicom has been remarkably successful in this expenditure reduction. In general this is an example of the general process that in New York has led to the demise of Madison Avenue as the global centre of the industry (Meyer 1991; Leslie 1995). The financial section of the distribution may be small but it does have interesting patterns. All three components show a cyclical pattern peaking around the turn of the century and this is clearly reflected in the total financial trend (the obverse of the production costs cycle) (Table 11). However, through this cycle it is profit rates that show a definite upward trend. This interesting contrast between profit and the other categories are more clearly seen if the financial category is analysed separately. In Table 12, the three components are shown as percentages of just the non-production accounts. Interest payments decline steeply, tax payments increase with revenues (Table 10) until recent years, and profits steadily increase from below 50% to over 60%. The effect is clear-cut: the financial category is used to maintain an increasing rate of profit irrespective of market conditions. Keeping shareholders happy creates the privileged category in this part of the revenue distribution, the equivalent of the privileging of labour in the production expenditure. The US and the Rest of the WorldBefore we leave the Omnicom analysis, there is one geographical question we can broach. Although the Annual Reports do not provide city market data as presented previously from Advertising Age data, for five years in the mid-1990s some data was provided on ‘domestic’ and ‘international’ accounts. Unfortunately this was not done for labour, office and interest expenditures but 4 key categories are available as shown in Table 13. The billings show that the US contributed just under half of the gross production. However, the revenues are consistently above the billings percentages: this indicates that Omnicom had higher commission rates in the US than in the rest of the world. This is different from the previous city market calculations of major firms’ commission rates that showed no differences between US and non-US cities (Table 8). Further, tax payment is appreciably lower percentage-wise than revenues except for one year when they are approximately the same. The difference is particularly marked in the final two years. The effect of all this is the clear trend of increasing profits from the US relative to the rest of the world. It is frustrating that this is just a short snap-shot of five years but we can conclude from this analysis that this large US transnational company is not ‘exploiting’ the rest of the world to benefit its US shareholders. As a professional knowledge company there is no use of cheap labour and low taxes abroad to bolster profitability: the tendency is for US work to subsidise non-US work! PART 4 CONCLUSION: STORY AND INTERPRETATIONThe basic story of advertising since 1990 can be summarised as follows. A leading industry because of its necessity to consumer capitalism, these high value knowledge firms followed their globalising customers to provide worldwide services by 1990. As expected from this ‘economic weather vain’ industry, billings have been cyclical. However, two important linear trends indicate key changes: increased concentration of ownership and reduced commission rates. The latter ‘revenue squeeze’ is likely a major cause of the former, leading to just three ‘mega-firms’ dominating the industry by the twenty first century. For one of these ‘global networks’ mega-firms, it has been shown that the revenue squeeze is countered for both labour costs (professional salaries) and profits (for shareholders) by upward trends in their respective percentage takes of revenues: whereas commissions declined by 7.4%, labour costs rose by 21.0% and profits rose by 32.1%. Hence professionals and shareholders have been designated the privileged (or protected) component of the contemporary workings of the advertising industry. Interpretation of these findings is complicated; we have to go back to the fact that the industry is a service provider and that the service being provided is itself quite unusual. As an expert knowledge service, the professionals are not only the labour, they embody the industry’s ‘raw material’ in the ‘gen’ they input into the production of the commodity. Thus labour ‘loyalty’ is essential and is reflected, not only in high renumeration, but also through ‘hand-cuff’ contracts restricting labour movement leading to client movement. The fact that the value of an advertising company is ultimately dependent on professionals and their client portfolios is directly recorded in company accounts as ‘goodwill’: for instance, at $6,411 million dollars, this is the largest individual item in Omnicom Group’s Balance Sheet for 2004. Obviously the labour costs in this industry cannot be treated in same way as for industries producing more tangible commodities (Natchum 1996, 2000). The literature on transnational class formation provides one means of interpreting our global advertising results. Sklair (2002, 98) premises his identification of a ‘transnational capitalist class‘ with the assertion that ‘(d)irect ownership or control of the means of production is no longer the exclusive criterion for serving the interests of capital, particularly not the global interests of capital’. He goes on to specify ‘globalizing professionals’ as one of four components of this contemporary capitalist class: they are the ‘technical fraction’ (p. 99). Of course this does not mean that ownership is longer relevant; it has also changed towards what Clark (2000) terms ‘pension-fund capitalism’. The up shot is that the ‘capitalist interest’ – capitalist accumulation - within advertising accounts is reflected not in ‘profits’ alone, but in their combination with renumeration of globalising professionals. These are the two categories that were found to be privileged in Omnicom Group’s accounts. Their joint take of the company’s revenues rose from 63.6% in 1993 to 77.6% in 2004, a whopping 22.0% increase: privileged indeed! Thus we can conclude that in this leading industry of contemporary capitalism, ‘global advertising’, revenue squeeze and ownership concentration are resulting in a financial bonanza for the transnational capitalist class.
ACKNOWLEDGEMENTSAsli Ceylan Oner (Virginia Tech) collected and analysed the Advertising Age data; Rolee Aranya (Trondheim University) helped with the references; and James Faulconbridge (Lancaster University) pointed me in the direction of Omnicom Group accounts. REFERENCESBagchi-Sen, S and Sen, J (1997) ‘The current state of knowledge in international business in producer services’, Environment and Planning A 29, 1153-74 Banerjee, A (1994) ‘Transnational advertising development and management: an account planning approach and a process framework’, International Journal of Marketing 13, 95-124 Brenner, R (2002) The Boom and the Bust. London: Verso Castells, M (1996) The Rise of Network Society. Oxford: Blackwell Clark G L (2000) Pension Fund Capitalism. Oxford: Oxford University Press Coopers and Lybrand (1992) The Advertisement Industry: an Examination. London: Coopers and Lybrand Economist, The (1990) ‘The advertising industry’ The Economist, 9 June Daniels, P W (1993) Service Industries in the World Economy. Oxford: Blackwell Daniels, P W (1995) ‘the internationalisation of advertising services in a changing regulatory environment’, The Service Industries Journal 15, 276-94 Dicken, P (2003) Global Shift. London: Paul Chapman Ducoffe, R.H. and Smith, S.J. (1993) ‘Mergers and Acquisitions among Advertising Agencies,’ in Alexander, A., Owers, J. and Carveth, R (eds) Media Economics: Theory and Practice pp. 309-330, Hillsdale, NJ: Lawrence Erlbaum Associates, Inc. Johnson,T J (1972) Professions and Power. London: Macmillan Kanso, Ali (1991) ‘The Use of Advertising Agencies for Foreign Markets: Decentralized Decision and Localized Approaches?’ International Journal of Advertising, 10, 129-136 Kim, K K (1995) ‘Spreading the net: the consolidation process of large transnational advertising agencies in the 1980s and early 1990s’, International Journal of Advertising 14, 195-217 Leslie, D A (1995) ‘Global scan: the globalization of advertising agencies, concepts and campaigns’, Economic Geography 71, 402-25 Marchand, R (1986) Advertising the American Dream: Making Way for Modernity, 1920-1940. Berkeley: University of California Press Mayer, M (1991) Whatever Happened to Madison Avenue? Boston: Little, Brown Monle L and Johnson C (1999) Principles of Advertising: A Global Perspective. New York : Haworth Press Morley, D and Robins K (1995) Spaces of Identity: Global Media, Electronic Landscapes and Cultural Boundaries. London: Routledge Nachum, L (1996) ‘Winners and losers in professional services/ what makes the difference? Empirical evidence for the advertising industry’, The Service Industries Journal 16, 474-90 Nachum, L (2000) The Origins of International Competitiveness of Firms: the Impact of Location and Ownership in Professional Service Industries. Cheltenham, UK: Edgar Eldar Sklair, L (2002) Globalization: Capitalism and its Alternatives. Oxford: Oxford University Press Sassen, S (1991/2001) The Global City. Princeton, NJ: Princeton University Press Sayer, A (2002) Method in Social Science. London: Hutchinson Taylor P J (1999) Modernities: a Geohistorical Introduction. Cambridge: Polity Taylor , P J (2004) World City Network: a Global Urban Analysis. London: Routledge Taylor, P J, Catalano, G and Walker, D R F (2004) ‘Multiple globalisations: regional, hierarchical and sectoral articulations of global business services through world cities’, The Services Industries Journal 24, 63-81 Tharp, M and Jeong, J (2001) ‘Executive insight: the global network communications agency’. Journal of International Marketing 8, 111-31 West, D (1996) ‘The determinants and consequencies of multinational advertising agencies’, International Journal of Advertising 15, 128-39 SOURCESAdvertising Age Agency Report, from the ‘46 th Annual Report’ (1991) to the ‘58 th Annual Report’ (2002) Omnicon Annual Report, from 1993 to 2004
Table 1: Billings, 1990-2001
* adjusted to 2000 values
Table 2: Cash flows through Omnicom in 2004
Source: derived by the author from ‘consolidated’ tables for ‘Omnicom Group Inc. and Subsidiaries’ in the Omnicom Annual Report 2004
Table 3: Top 40 City Advertising Markets
Table 4: Rising Corporate Concentration, 1990-2001
Table 5: Changing Growth Rates, 1990-2001
Table 6: Revenues, 1990-2001
* adjusted to 2000 values
Table 7: Corporate Concentration by City
Table 8: Estimated Commission Rates by City
Table 9: Omnicom in the Top 40 City Advertising Markets, 2001
Source: calculated from Omnicom entry in Advertising Age Annual Report 2002 Table 10: Omnicom: billings, growth, revenue and commission rates, 1990-2001
* adjusted to 2000 values Table 11: Omnicom: distribution of revenue, 1993-2004
Source: calculated from Omnicom Group Annual Reports
Table 12: Omnicom: distribution of non-production revenue
Source: calculated from Omnicom Group Annual Reports Table 13: Omnicom Group: US contributions, 1993-98
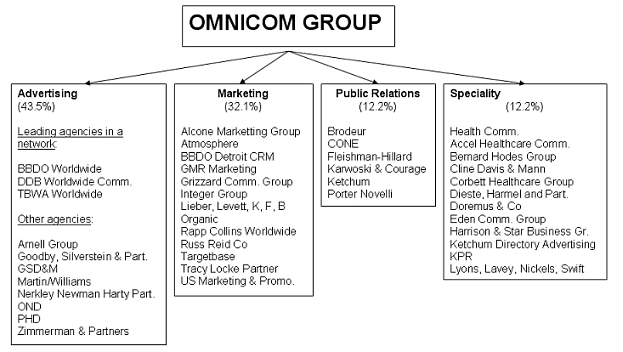
Figure 1: Constituent parts of the Omnicom Group (%s refer to revenues)
Source: Advertising Age Annual Report, 2002. It shows just the major firms and therefore under-estimates the complexity. For instance, in the Omnicom Annual Report, 2002, the acquisition of Organic, Inc is reported but this was only one of 40 acquisitions that year, none of the other 39 is recorded above.
Edited and posted on the web on 16th March 2006; last update 7th June 2006
|
|||||||||||||||||||||||||||||||||||||||||||||||||||||||||||||||||||||||||||||||||||||||||||||||||||||||||||||||||||||||||||||||||||||||||||||||||||||||||||||||||||||||||||||||||||||||||||||||||||||||||||||||||||||||||||||||||||||||||||||||||||||||||||||||||||||||||||||||||||||||