GaWC Research Bulletin 181 |
|
|
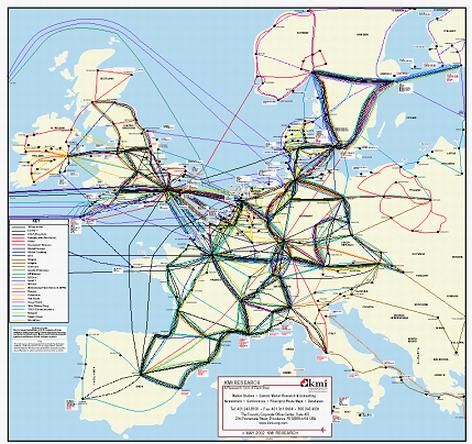
1. INTRODUCTIONThe raison d’être of telecommunications is connection. Telecommunications are all about (inter)connecting people, firms, cities, regions, territories, etc. If, as world cities researchers have constantly emphasised, a principal function of cities is the development of connections to other places, and that those cities with the most connections are the most economically dominant, then it would be reasonable to suggest that the quality and quantity of telecommunications networks and flows between cities might be an important reflection of the formation of what Peter Taylor has conceptualised as a ‘world city network’ (Taylor, 2003b). As Stephen Graham has argued: “It has emerged that current advances in telecommunications are a set of phenomena which tend overwhelmingly to be driven by large, internationally oriented, global metropolitan regions. The activities, functions and urban dynamics which become concentrated in global city-regions rely intensely on the facilitating attributes of advanced telecommunications for supporting relational complexity, distance links and snowballing interactions, both within and between cities” (Graham, 1999, p. 947). In recent years, the growth in telecommunications has been nothing less than spectacular, with the number of global main telephone lines having increased eightfold since 1960, and by nearly 60 percent just between 1990 and 1997; with cellular lines having also added hundreds of millions of units; and this is without mentioning the phenomenal rise of the internet (Schiller, 1999). It is these burgeoning informational and communicational connections which have underpinned the ‘rise of the network society’ (Castells, 1996), but to socially and spatially variable extents. Not the least of these has been the increasing tendency for telecommunications investment, supply, demand and usage to be concentrated in and between major cities, and within cities, to be focused on the office spaces and buildings housing large corporate enterprises and organisations (Graham, 1999; 2000; Rutherford, 2005). It is notable that the geography and urban studies literature has, in recent years, seen an increasing number of analyses of two forms of inter-city relations. First, exploration and analysis of the ‘economic’ flows and interdependencies between world cities (particularly the locational networks of multinational firm offices) has been driven largely, but not exclusively, by the work of the GaWC (Globalization and World Cities) group1 (see, for example, Beaverstock, Smith and Taylor, 2000; Taylor, Catalano and Walker, 2002a; 2002b; Alderson and Beckfield, 2004; Jones, 2002). Second, a number of researchers have studied the development of backbone telecommunications networks between the same cities (see, for example, Malecki, 2002; Malecki and Gorman, 2001; O’Kelly and Grubesic, 2002; Rutherford, Gillespie and Richardson, 2004; Townsend, 2001; Wheeler and O’Kelly, 1999). Rarely, if ever, however, have the links between the two been explored in any detail.2 This is in spite of theorists such as Castells and Sassen underlining the crucial importance of electronic information and communication networks to the urban focus of the restructuring of the global economy.3 As Peter Rimmer has suggested: “Many of the propositions on telecommunications and world cities have to be taken on trust” (Rimmer, 1998, p. 451). In contrast, meanwhile, analyses of transport (particularly airline) flows between cities have been far more numerous (Cattan, 1995; Keeling, 1995; O’Connor, 1995; Rimmer, 1998; Smith and Timberlake, 2002; Witlox, Vereecken and Derudder, 2004; Zook and Brunn, 2004). This paper contributes to filling this gap. By analysing a recently obtained data set of inter-city telecommunications networks in Europe, using some of the basic analytical techniques suggested by GaWC researchers, we offer a first attempt at measuring the technological connectivities of these cities that underpin (and reflect) their positions in the world city network. First, we discuss briefly the development of the ‘world cities’ literature, and the analytical pertinence of its recent directions. In a second section, we address the use of telecommunications data for exploring the flows and relations between cities, and highlight some of the deficiencies and limitations of such data. In the main sections of the paper, we go on to attempt a first ‘world city network’ perspective on telecommunications links between European cities based on an inter-city relational matrix. Finally, we discuss the possibilities and limitations of such analyses for further research. 2. WORLD/GLOBAL CITIES, NETWORKS, AND COMMUNICATIONSContemporary political and economic processes and practices of restructuring have substantially altered both the ways in which cities work and develop, and the ways in which the differing elements of urban development have been theorised and analysed. These restructuring dynamics are generally associated with the wider mechanisms of political and economic ‘globalisation’. In spite of the materially and discursively blurred and amorphous nature of this dynamic, one thing which has appeared to produce agreement among theorists is the increasing importance of cities within globalisation. Indeed, this paradoxical reaffirmation of ‘local’ places as fixed sites from which the global economy is mobilised has countenanced this lack of theoretical clarity, and distracted attention away from apparently more logical arguments wherein globalisation is a direct threat to distance, space and the pertinence of place. The geography of the global economy is, therefore, a substantially urban geography, but an urban geography that has been significantly rescaled to reach from local to global and back again. This geography has increasingly been conceptualised as that of the ‘world city’ or the ‘global city’. John Friedmann’s (1986) classic paper expounding ‘the world city hypothesis’ (following on from his earlier paper with Goetz Wolff (Friedmann and Wolff, 1982)) was certainly not the first work to highlight the importance of large cities within a dominant global economic system (this work drew on the ideas and theories of the likes of Patrick Geddes, Peter Hall and Immanuel Wallerstein), but it has been cited regularly by subsequent world cities researchers as one of the first works to explicitly conceive of large cities both as ‘basing points’ for global capital in the restructuring of economic production and markets, and as developing linkages with other cities through which their ‘world’ status is sustained. It was also one of the first attempts at classifying these cities (and their linkages) into a spatial hierarchy of primary and secondary centres and relations. Subsequent work4 has built on this to describe the ‘function’ of these cities ( London, New York and Tokyo being the most regularly cited triumvirate) as “command points in the organisation of the world economy” (Sassen, 1991, p. 3). In other words, within a complex ‘network society’ (Castells, 1996) or ‘world city network’ (Taylor, 2003b), some cities gain and retain economic power and control through a predominant capacity as centres for the vast array of producer services which tend to the every need of multinational corporations. In turn, it is argued that, given that these services now work on a global level through the development of connections and flows between the numerous offices of firms located around the world, it is these inter-urban connections and flows which now constitute the major source of economic power for world cities, rather than any traditional locational assets (Beaverstock, Smith and Taylor, 2000). In other words, “cities accumulate and retain wealth, control, and power because of what flows through them, rather than what they statically contain” (Beaverstock, Smith and Taylor, 2000, p. 126). Much debate has surrounded the question of the validity and approach required to updating the hierarchy of world cities, initiated by Friedmann (see, for example, Godfrey and Zhou, 1999; Hall, 2001; Pumain, 1992; Wegener, 1995; Cheshire, 1990; Lever, 1993 ). Clearly, engaging in attempts at classifying cities should have more reasoning behind them than academic obsession with order and categorisation, and most researchers argue that urban hierarchies allow us to better explore where the power lies in global urbanisation and how functional distinctions between cities reflect on their relative economic power. However, until recently, there has been little consensus about the data on ‘economic power’ used to constitute these hierarchies, and even a complete lack of data on the inter-city relations mentioned above as being defining to world cities research (Short et al, 1996, Taylor, 1997). In recent years, the work of the GaWC research group based at Loughborough University has been crucial to developing an alternative ‘metageography’ of a network of world cities (Beaverstock, Smith and Taylor, 2000), and overcoming the inherent ‘embedded statism’ of much research into global processes (Taylor, 1996; 2000). This work has included the search for and analysis of inter-city (rather than inter-state) relational data, which can, importantly, be constructed into matrices of linkages.5 The in-depth analysis of resulting data sets, based on the global office location networks of major producer service firms in the fields of law, banking, insurance and advertising, have operationalised this new metageography of world city network formation through measuring inter-city relations (‘global network connectivities’) represented by global economic service flows (Beaverstock, Smith and Taylor, 2000; Taylor, Catalano and Walker, 2002a; Taylor, Catalano and Walker, 2002b; Taylor, 2003b). At the same time as this ‘corporate organisation approach’ or level of focus, other research in the broad world cities domain has focused more on an ‘infrastructure approach’ or level (Derudder, Vereecken and Witlox, 2004), albeit usually without explicitly tying communications network linkages between cities into a world city network formation perspective. Indeed, the validity of such an approach has been questioned by Peter Taylor in arguing that “infrastructure networks are important and are necessary to support the world city network but they do not define it” (Taylor, 2001, p. 182). This implies that the inter-city connections of transport and telecommunications networks do not apportion the same level of ‘defining’ power and control to connected world cities as do the shared office locations of major producer service firms. This is perhaps because the former are not seen as measuring the “actual inter-city social practices that have created a world city network” (Taylor, 2003b, p. 33), but as merely representing the first infrastructural level of Castells’ space of flows rather than the space of flows as a whole. Yet, as has been argued elsewhere ( Rutherford, 2004; 2005), the process of developing communications networks and connections in and between world cities must be viewed as an inherently ‘social practice’ of negotiation and strategic decision-making, which is thus bound up with all three levels of the space of flows. Analysis of telecommunications networks and flows in a world city network perspective can, thus, be approached from either or both the ‘corporate organisation’ and ‘infrastructure’ angle, by conceptualising telecommunications provision as a producer service in the first case, and as a series of infrastructural linkages and flows in the second case.6 Two recent papers from researchers at Ghent University have offered perhaps the first real world city network analysis within the infrastructure approach, focusing on global air passenger transport flows and using an exceptionally detailed database matrix (Derudder, Vereecken and Witlox, 2004; Witlox, Vereecken and Derudder, 2004). As Nadine Cattan has suggested: “Because of its relatively rapid capacity to reply in terms of supply and demand, air traffic provides a pertinent indicator in the quest to evaluate the international character of cities” (Cattan, 1995, p. 303). It is the intention of this paper to explore the possibilities of offering a similar analysis focusing on telecommunications networks and flows, and we begin this task in the next section. 3. MEASURING THE TECHNOLOGICAL/ELECTRONIC CONNECTIVITIES OF THE WORLD CITIES AND THE TELECOMMUNICATIONS DATA PROBLEMSmith and Timberlake have suggested that: “The intercity network described by FAXes, telephone calls, and Internet communications would also provide an extremely relevant map of the network of world cities. But we are not aware of any publicly available systematic accounting of the flows of such communications across the web of international cities” (Smith and Timberlake, 2002, p.121). As well as a relative lack of data, a number of other limitations can be discerned in the use of telecommunications data within world cities research.7 The focus of the rare data that can be found obstructs meaningful analysis. Data is frequently of a regional rather than global nature, i.e. it only includes European or North American sections of networks, rather than global networks per se. Available information concerns network provision rather than actual traffic flows, due to the extreme complexity of being able to count millions and millions of communications. Data is rarely comparable (different years, different scales of focus, different methods of production, etc), often incomplete (some telecommunications providers will give out some information, whilst others will not), and is out-of-date virtually as soon as it appears (due to the fast-moving nature of technological innovation and market decisions). Finally, we do not have sufficient information on how (and where exactly) differing proprietary networks interconnect to form a global telecommunications infrastructure such as the internet (Grubesic and Murray, 2005). In what follows, we make no pretention that the data set we rely on for our analysis is untouched by these limitations. Indeed, it is likely that it is restricted by each of the concerns listed above. However, by using similar analytical techniques to those used by GaWC researchers in a number of papers of recent years, we believe that some interesting and important results develop from a world city network perspective which begin to shed light on the technological/electronic connectivities of cities (and how these compare to their ‘economic’ connectivities). 4. EUROPEAN CITIES IN THE WORLD CITY NETWORK AND THEIR INTER-URBAN TELECOMMUNICATIONS RELATIONSAs we described above, the major contribution of the work of the GaWC group in recent years has been to seek out, identify and analyse relations between world cities in the domain of producer service firms and their office locations, and to conceptualise these relations as representing the economic power of globalising cities in the world city network (Beaverstock, Smith and Taylor, 2000; Taylor, 2003b). Building on this pioneering work, in this section we use important new telecommunications data concerning network and bandwidth connections between European cities to initiate analysis of the extent to which the ‘technological connectivities’ of these cities reflect or differ from the findings of the GaWC group for producer service relations. Ideally, the following analysis would be based on a data set of global telecommunications networks and flows. However, as mentioned in section 3, one of the frequent limitations of telecommunications data is its regional rather than global focus, which means that in this case, we were only able to obtain a European data set.8 Before we embark upon this analysis, therefore, one important consideration to bear in mind relates to the need for caution highlighted by the GaWC group when only studying part of the world city network. They show how world cities cannot be analysed within bounded scales (national, regional, etc). Taylor and Derudder (2004) have, for example, introduced the concept of a ‘porous Europe’ when studying the connectivities of European cities, arguing that “under conditions of contemporary globalization it is impossible to sensibly discuss European inter-city relations separate from an encompassing world city network” (Taylor and Derudder, 2004; see also Taylor and Hoyler, 2000). Although the fact that our data is limited to Europe, we stress that these ‘European’ telecommunications networks are part of wider global telecommunications networks, as the bandwidth passing through European cities connects these to non-European cities as well (even if we do not have specific data on the extent to which and how this is the case). For example, the total bandwidth passing through London includes its connections to New York as well as European cities, even if the technical and strategic properties of telecommunications networks (construction in inter-city rings) do not allow us to have a breakdown of how important a relational connection London- New York is compared to London-Paris. In other words, we do try to offer a ‘world city network’ perspective on the technological connectivities of European cities. In fact, we would argue that telecommunications highlight as well as anything the nature and extensiveness of global linkages ‘under conditions of contemporary globalisation’. If only the data existed to be able to fully and globally illustrate this. The analysis is divided into three parts. First, we analyse shared backbone provider presences and linkage probabilities (section 5). Second, we consider inter-city lit bandwidth (section 6). Third, we develop comparisons of technological and economic connectivities of European cities in the world city network (section 7). A Word on Method – The Construction of Inter-city Matrices?The first question was to decide on how to delimit which European cities to include in the study. As our dual aim in this paper is initially to present and analyse measures of technological connectivity of European cities, and then to compare these connectivities with the economic connectivity measures of the GaWC group, we have simply used the cities included in our main data resources in the first instance, and then for the comparative section ensured we include the major cities for which we have comparable technological and economic measures (i.e. all cities present in both our data and that of GaWC), thus unfortunately excluding those cities absent from either data set. The next step was to obtain sets of telecoms data which could be compared to the GaWC economic connectivity data. We used two resources for this. First, supply data extracted from a map of inter-urban networks obtained from telecommunications consultants KMI (see section 5 for fuller description of this), and second, inter-urban demand and usage data supplied by consultants Telegeography .9 In this way, our analysis of the technological connectivities of European cities in the world city network includes both supply- and demand-side data. However, only the supply data (network connections for 27 providers across 209 cities) was able to be constructed into a 209 x 209 inter-city matrix, highlighted by GaWC researchers as crucial to developing sets of relational data. The demand data is not as detailed, but still represents an amalgam of inter-city relational links for each city, even if information on individual connections between cities is not available (for technical and quantification reasons). 5. SHARED BACKBONE PROVIDER PRESENCES AND LINKAGE PROBABILITIESDescription and Transformation of the Network Supply DataFigure 1 – Pan-European fibre optic network routes planned or in place |
CITY |
Wien |
Klagenfurt |
Graz |
Linz |
Salzburg |
Innsbruck |
Bruxelles |
Antwerp |
Gent |
Oostende |
… |
Wien |
|
|
|
|
|
|
|
|
|
|
… |
Klagenfurt |
3 |
|
|
|
|
|
|
|
|
|
… |
Graz |
2 |
2 |
|
|
|
|
|
|
|
|
… |
Linz |
2 |
2 |
1 |
|
|
|
|
|
|
|
… |
Salzburg |
2 |
2 |
2 |
1 |
|
|
|
|
|
|
… |
Innsbruck |
1 |
1 |
1 |
1 |
1 |
|
|
|
|
|
… |
Bruxelles |
8 |
2 |
1 |
1 |
1 |
0 |
|
|
|
|
… |
Antwerp |
7 |
2 |
1 |
1 |
1 |
0 |
13 |
|
|
|
… |
Gent |
3 |
1 |
1 |
0 |
1 |
0 |
3 |
3 |
|
|
… |
Oostende |
2 |
1 |
1 |
0 |
1 |
0 |
2 |
2 |
2 |
|
… |
… |
… |
… |
… |
… |
… |
… |
… |
… |
… |
… |
|
Source: abstracted by the authors from KMI Research map.
Table 2 – Cities with most pan-European networks
Rank |
City |
Number of pan-European networks present |
1 |
Hamburg |
21 |
2 |
London |
19 |
3 |
Dusseldorf |
18 |
4 |
Paris |
17 |
|
Amsterdam |
17 |
6 |
Frankfurt |
16 |
7 |
Brussels |
15 |
|
Munich |
15 |
|
Bremen |
15 |
10 |
Berlin |
14 |
|
Lyon |
14 |
|
Stockholm |
14 |
13 |
Antwerp |
13 |
|
Geneva |
13 |
|
Zurich |
13 |
|
Milan |
13 |
17 |
Stuttgart |
12 |
|
Essen |
12 |
|
Copenhagen |
12 |
|
Strasbourg |
12 |
|
Oslo |
12 |
|
Malmo |
12 |
|
Bristol |
12 |
24 |
Basle |
11 |
|
Nurnberg |
11 |
|
Hannover |
11 |
|
Madrid |
11 |
|
Bordeaux |
11 |
|
Marseille |
11 |
30 |
Vienna |
10 |
|
Mannheim |
10 |
|
Cologne |
10 |
|
Dortmund |
10 |
|
Barcelona |
10 |
|
Montpellier |
10 |
36 |
Bielefeld |
9 |
|
Leipzig |
9 |
|
Toulouse |
9 |
|
Turin |
9 |
|
Rotterdam |
9 |
|
Birmingham |
9 |
Source: abstracted by the authors from KMI Research map.
Table 3 – The most important inter-city relations
Cities |
Number of network connections |
Hamburg – Dusseldorf |
17 |
Dusseldorf – Amsterdam |
16 |
Paris – London |
|
Amsterdam – Hamburg |
|
Amsterdam – London |
|
London – Hamburg |
|
Dusseldorf – London |
15 |
Paris – Brussels |
|
Paris – Dusseldorf |
|
Paris – Amsterdam |
|
Bremen – Hamburg |
|
Bremen – Dusseldorf |
|
Frankfurt – Dusseldorf |
|
Brussels – Dusseldorf |
14 |
Brussels – Amsterdam |
|
Brussels – London |
|
Munich – Berlin |
|
Munich – Hamburg |
|
Munich – Dusseldorf |
|
Berlin – Hamburg |
|
Berlin – Dusseldorf |
|
Hamburg – Frankfurt |
|
Hamburg – Paris |
|
Hamburg – Stockholm |
|
Frankfurt – Paris |
|
Source: abstracted by the authors from KMI Research map.
Our full data set records 1,019 network presences of providers across the 209 cities. This is the total service sum of the whole ‘network’.
Figure 2 illustrates how this overall ‘network service’ is distributed between European cities, with clearly far larger numbers of cities with few providers present than with many providers present.
Figure 2 – Overall frequency distribution of pan-European providers in European cities
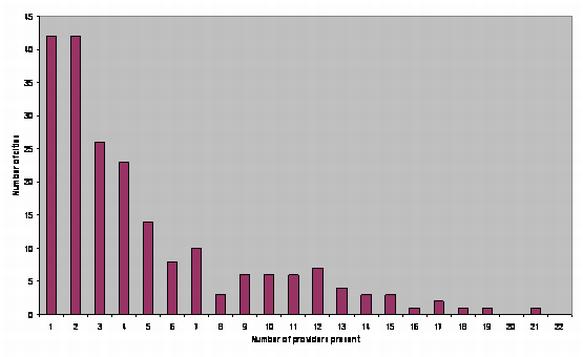
Source: abstracted by the authors from KMI Research map.
Although the resulting data set creates a relational matrix of the kind which is held to be crucial for analysis of inter-city links, it provides only simple binary presence/absence data for all cities. Table 4 shows the European cities which are most connected via backbone networks to other European cities in our data set. It is little surprise that Hamburg, having highest presence of networks, is the most connected city with single or multiple links to all but nine of the 209 cities considered (the exceptions being Innsbruck, Aarhus, Corfu, Patras, Athens, Verona, Trieste, Naples and Bari).
Table 4 – The top ten European cities for backbone links to other nodes
City |
Binary links (number of other urban areas connected on 27 backbone networks) |
Hamburg |
200 |
London |
192 |
Lyon |
188 |
Amsterdam |
185 |
Stockholm |
184 |
Dusseldorf |
182 |
Munich |
181 |
Frankfurt |
180 |
Bremen |
180 |
Paris |
179 |
Brussels |
179 |
Source: abstracted by the authors from KMI Research map
This simple binary measure of presence or absence of connection between cities obviously does not tell us very much about the level of connection either in terms of number of networks or network capacity. It crucially lacks therefore a qualitative element which is present in much of the GaWC data set, where they attempt as best as possible to differentiate the importance of cities to the same firm, usually by number of employees, etc. and then give relevant scores to cities based on this. We suggest that it is both more difficult and less necessary to do this for telecoms providers. Firstly, data on how important cities are to individual providers are not usually available. Secondly, it is less clear how we would measure this in any case. It would not be by number of employees as this does not affect their network service provision between cities, but it would have to be by some measure of type or level of network service available in each city. For instance, cities with MANs (Metropolitan Area Networks) might score higher than cities which are merely POPs (points of presence) on a network. Yet this may be viewed as rather inadequate as well, as it misses the inherently interconnected nature of all cities on the same telecommunications network in favour of a rather artificial division of each network into separate nodes. (Because providers commonly deploy their networks in ring architectures where all cities on the ring have access to the full bandwidth of the network (Telegeography, 2004), we are talking here about quintessentially relational intercity networks, therefore we need a qualitative measure of each network that represents how relational a network is, i.e., how many cities are interconnected.) Instead, in order to add a qualitative measure of the relative importance of each provider network, we have taken an overall network approach, whereby we distinguish between the overall importance of all the cities to all providers by scoring cities according to their total connectivity through all providers. This allows us to differentiate between the extensiveness of the networks of providers, so that inevitably cities score more for being on the extensive network of Energis (serving 84 cities) than being on the limited network of Silk Route (2 cities) (see table 5 for the relative extensiveness of all 27 networks). In this way, measuring the total number of all links on all networks between nodes gives us an indication of the cities connected by ‘redundant’ paths (i.e. two cities connected via more than one backbone). Core cities are interlinked by numerous parallel networks creating high numbers of redundant connections, whereas peripheral cities with only a small network presence have relatively few ‘extra’ redundant links (and none if only one network is present).
Table 5 – The relative extensiveness of pan-European networks
Pan-European network provider |
Number of cities served by network |
Energis (with Worldport) |
84 |
Carrier 1 |
74 |
Telia (Viking Ring) |
72 |
Global Crossing |
70 |
360networks |
68 |
Worldcom |
68 |
GTS |
67 |
Interoute |
60 |
COLT (Eurolink) |
55 |
KPNQwest |
54 |
LDCom |
39 |
Level 3 |
38 |
Viatel (Circe) |
36 |
Ipsaris (Fiberway) |
35 |
Versatel |
28 |
Song (Tele1) |
26 |
TYCO Communication |
21 |
Infigate |
19 |
GlobalConnect |
18 |
Pangea |
16 |
Powercom |
16 |
Me tromedia Fiber Network (MFN) |
15 |
Enitel |
14 |
MTCAG |
14 |
Grapes |
6 |
Eurotunnel Telecom |
4 |
Silk Route |
2 |
Source: abstracted by the authors from KMI Research map
Calculating the number of links on all networks between all cities gives us a total network interlock (sum of the situational status for all cities) of 54076. Within this, Hamburg has the highest interlock connectivity (situational status) at 894, and Corfu, Patras and Naples the lowest at 5. Table 6 again shows the top ten cities, with very little hierarchical difference occuring between cities for these redundant links compared to the single links of table 2. Figure 3 illustrates how the interlock connectivity of individual European cities falls away quite rapidly the further down the rank of cities we go.
Table 6 – The top ten European cities for total redundant backbone links to other nodes
City |
Redundant links (number of other urban areas connected on 27 backbone networks) |
Hamburg |
894 |
Dusseldorf |
861 |
Paris |
855 |
London |
854 |
Amsterdam |
842 |
Frankfurt |
803 |
Lyon |
795 |
Brussels |
786 |
Munich |
778 |
Geneva |
771 |
Zurich |
771 |
Source: abstracted by the authors from KMI Research map
Figure 3 – Log graph of network connectivities of the 209 cities
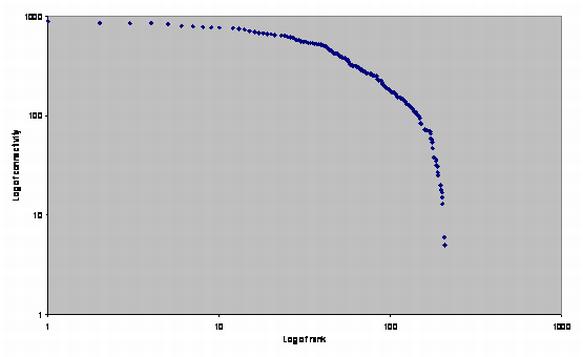
Source: abstracted by the authors from KMI Research map
Thus, although our method in arriving at the total network interlock and relative interlock connectivities of cities differs necessarily from that of GaWC, we suggest that the end result is compara ble nonetheless because of the crucial qualitative relational component for studying the links between cities.
Following the example of Beaverstock, Smith and Taylor (2000) and Taylor, Walker and Beaverstock (2002), another interesting and valuable type of analysis we can perform is that of connectivity probabilities between cities. In order to do this, we focus on those 41 cities which have a third or more presences of the 27 pan-European networks mapped by KMI (i.e. 9 or more networks – see table 2).
The shared backbone provider presences between cities are shown in table 7. Each cell indicates the number of providers whose networks have nodes in both cities. For example, Hamburg and Dusseldorf ‘share’ 17 networks, while London ‘shares’ 16 networks with Hamburg, Paris and Amsterdam. It is therefore not surprising that these are the cities which we saw earlier as having the highest overall presence of backbone networks. Nevertheless, it is worth noting that the table shows that each of the 41 cities is connected to all the others via at least 3 different networks. The focus on the most connected cities would lead us to expect this kind of result, yet the fact that cities as diverse and geographically distant as Malmo, Vienna, Madrid and Bristol are linked by at least 3 telecoms networks does illustrate the highly interconnected nature of the vast European territory – as long as one does not look too far to the east !
It is also interesting to look at the average numbers of shared networks (table 8), as only 12 cities ‘share’ with their counterparts more than 10 average points of presence of the 27 total backbone providers considered.
Table 7 – Relations between European cities: shared pan-European backbone provider presences

Source: abstracted by the authors from KMI Research map
Table 8 – Average presences
City |
Average |
Hamburg |
11.38 |
Dusseldorf |
11.28 |
Paris |
11.00 |
Amsterdam |
10.88 |
London |
10.58 |
Frankfurt |
10.43 |
Munich |
10.28 |
Lyon |
10.28 |
Berlin |
10.23 |
Zurich |
10.13 |
Geneva |
10.13 |
Brussels |
10.05 |
Bremen |
9.83 |
Milan |
9.55 |
Stuttgart |
9.18 |
Stockholm |
9.10 |
Antwerp |
8.98 |
Madrid |
8.88 |
Marseille |
8.85 |
Bordeaux |
8.85 |
Strasbourg |
8.73 |
Basle |
8.65 |
Essen |
8.48 |
Hannover |
8.45 |
Nurnberg |
8.28 |
Barcelona |
8.23 |
Montpellier |
8.00 |
Bristol |
7.83 |
Cologne |
7.68 |
Oslo |
7.55 |
Dortmund |
7.40 |
Toulouse |
7.18 |
Mannheim |
7.08 |
Birmingham |
7.05 |
Rotterdam |
6.95 |
Vienna |
6.93 |
Copenhagen |
6.90 |
Turin |
6.88 |
Leipzig |
6.78 |
Bielefeld |
6.78 |
Malmo |
6.20 |
Source: abstracted by the authors from KMI Research map
Table 9 – Matrix of pan-European backbone presence linkage indices for European cities

Source: abstracted by the authors from KMI Research map
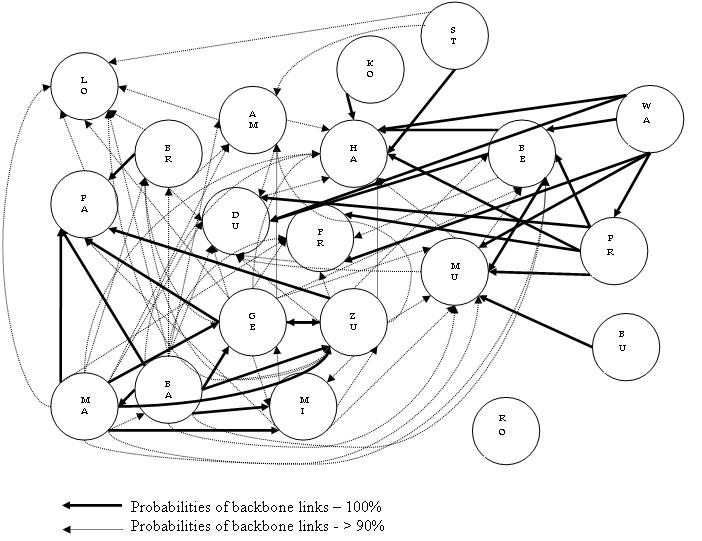
As Beaverstock, Smith and Taylor noted, “Shared presences define a symmetric matrix that shows sizes, but not the direction, of inter-city relations” (Beaverstock, Smith and Taylor, 2000, p128). They went on to construct an asymmetric matrix to indicate the probabilities of links between cities. This introduces a directional component to inter-city relations, indicating, for example, that links between two cities are stronger in one direction than the other. Our equivalent matrix for backbone telecommunications links is shown in table 9. The cells contain the probability of backbone providers with points of presence in the cities in the first column also having points of presence in the cities in the top row. Thus, according to our table, if a backbone provider has a point of presence in Brussels, there is a 93% probability that it will also have a point of presence in London. On the other hand, if a backbone provider has a point of presence in London, there is only a 74% probability that it will also have a point of presence in Brussels. Again, in a similar fashion to Beaverstock, Smith and Taylor, the major probability links are shown in figure 4.
The main point emanating from this diagram is that the major probability links usually concern the most networked cities. Hamburg, Dusseldorf and Paris have the most inward vectors from other cities (14-16 in each case) representing 100% probability of shared backbone links, so these cities appear to have points of presence of backbone providers, which are common to a number of other cities. On the other hand, points of presence in these cities do not always lead to very high probabilities of equivalent points of presence in less networked cities. In this regard, our findings for these inter-city telecommunications relations appear similar to the findings of Beaverstock, Smith and Taylor for producer service office locations, where the cities with the overall most offices ( London and New York) had the highest probabilities of being linked to from other cities. However, the curious exception to this rule is London, which, in spite of being the second most networked city, has only 1 inward vector (from Birmingham), and therefore, only 1 other city where the probability of a point of presence of a telecoms provider there gives a 100% assurance that a provider is also present in London.11 Yet with slightly fewer backbone presences (17), this is the case with Paris for no less than 16 other cities, i.e. there is 100% probability that a backbone provider with a point of presence in Brussels, Antwerp, Geneva, Basle, Zurich, Mannheim, Madrid, Barcelona, Strasbourg, Bordeaux, Toulouse, Montpellier, Marseille, Turin, Rotterdam and Birmingham will also be present in the French capital. It is also interesting to note that 100% probability links also exist to Geneva from Madrid, Barcelona and Zurich, and to Zurich from Madrid, Barcelona and Geneva. The main Swiss and Spanish networked cities appear, therefore, to be important parts of the roll-out strategies of the same backbone providers. Geography and national boundaries do appear to have some relevance here, as the proximity of cities to each other and/or the presence of two or more world cities within the same country lead to high probabilities of sharing backbone networks (Madrid and Barcelona, Geneva and Zurich, the German cities, Copenhagen and Hamburg), which is not surprising as providers prefer deploying short distance links and connecting proximate cities. Nevertheless, as the GaWC group frequently highlight, however apparent certain observations might be, there has been very limited previous analysis of these inter-city relations.
Figure 4 focuses on the most networked cities according to the KMI data. We can also show probability links between those cities which are already suggested as being the most economically powerful, i.e. the major ‘world cities’ of Europe. In this way, we avoid restricting our analysis to either only the most technologically advanced cities or only the most economically powerful cities. Figure 5 illustrates, therefore, both primary and secondary probability links between the original twenty alpha, beta and gamma world cities of Europe highlighted by the GaWC group. Importantly, this brings in three cities of eastern Europe, Prague, Warsaw and Budapest, which would have been left out by a focus purely on European cities with most telecoms networks. Prague and Warsaw have notably strong links with all German cities, with all network providers present in the Czech and Polish capitals being also present in all five German cities. Again, London proves to be an interesting example, with eight cities having 90% or more probability links, in addition to Birmingham’s 100% probability link shown in figure 4, although even here, there are no cities with which London has a greater than 90% probability of sharing a link through a London-based network provider. This would appear to indicate a certain level of particularity in the telecoms providers present in London, which, using world city network terminology, suggests the ‘cliquishness’ of the British capital within the (European) network as a whole. In other words, London appears to be part of a less interconnected subgroup, with Hamburg, for example, as part of another more interconnected subgroup, despite the similar numbers of providers present in both cities. We can hypothesise that the ‘cliquishness’ of London vis-à-vis its European counterparts may be offset by a more important level of connection to North American cities, due to its long-standing liberalised market advantages,12 but this would require further investigation and the availability of a more extended data set to be verified.
On the whole, figures 4 and 5 posit the existence of two inter-connected blocks of telecoms network links. First, a German-centred one, which incorporates Nordic cities on its northern edge, and eastern European cities on its eastern edge. Second, a ‘Romanic’ block, including French, Spanish, Swiss and Italian cities. Geography and culture can be identified as determining factors here. On the one hand, it is clear that the probability of network links tends to increase if cities are proximate. On the other hand, however, this does not explain everything, as there appears to be an additional cultural element, whereby providers ‘focus’ their strategies either on or within the two blocks identified above, thus increasing the probability of links between cities within the same country or within the same block, and negating the likelihood of links between cities in different blocks, even if they are geographically close (for example, Swiss and German cities; Benelux and German cities).
Figure 4 – Vector showing primary probability backbone provider links among European cities (top networked cities)
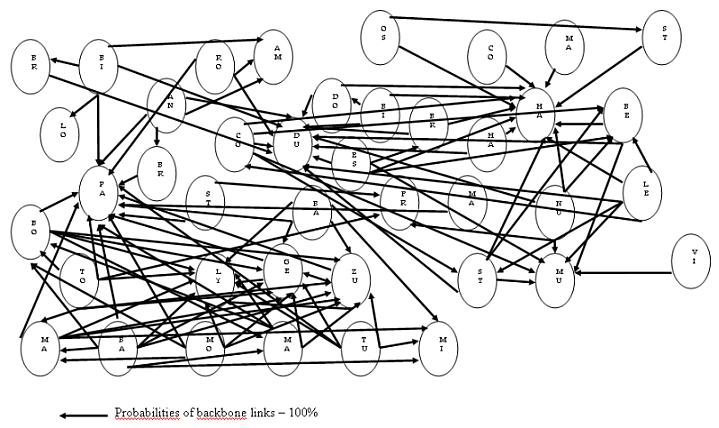
Figure 5 – Vector showing primary and secondary probability backbone provider links among European cities (‘world cities’)
Both vectors show some of the core-periphery structuring aspect of pan-European telecommunications connections. We can suggest, then, that the network power / gateway cities thesis holds best here as pan-European providers ‘need to be’ primarily in cities in the core of Europe. They are therefore more likely to be present in smaller German and French cities than more economically powerful but geographically peripheral capital cities such as Rome, Budapest and Vienna.
The previous section analysed the service status of European cities in terms of network supply connectivities. In this next section, our aim is to study the connectivities of cities using data on bandwidth supply and usage.
The origin of the data used here is the ‘supply and demand’ chapter of the 2004 ‘Terrestrial networks’ report by the Telegeography consultancy (Telegeography, 2004). It is notable, therefore, that this data set is more up-to-date than that used in the previous section, which, given the fast-moving nature of the telecommunications sector, is not inconsiderable. The Telegeography report offers in particular two tables listing the top European cities for network supply and for network usage.
Table 10 – Top 10 European cities for lit bandwidth
Rank |
City |
Lit bandwidth (Tbps) |
Proportional to highest |
1 |
Frankfurt |
10.2 |
1 |
2 |
London |
9.5 |
0.93 |
3 |
Paris |
9.2 |
0.90 |
4 |
Copenhagen |
8.8 |
0.86 |
5 |
Berlin |
8.3 |
0.81 |
6 |
Hamburg |
8.3 |
0.81 |
7 |
Amsterdam |
8.1 |
0.79 |
8 |
Stockholm |
8 |
0.78 |
9 |
Brussels |
7.7 |
0.75 |
10 |
Dusseldorf |
7.6 |
0.75 |
Source: Telegeography (2004)
Table 10 shows the top ten European cities for lit bandwidth, as both a gross score and as a proportion of the highest individual score. Lit bandwidth refers to capacity on fibre-optic cable networks which is actually available for use, compared to the far greater unlit capacity of all deployed cables, which was a result of the overenthusiastic network construction strategies of bandwidth providers at the height of the telecoms boom a few years ago. To give some idea of the difference, although there is 10.2 Tbps (terabits per second – a trillion bits per second) of lit capacity in Frankfurt, according to Telegeography, the German city actually has a total of 357.6 Tbps of maximum bandwidth. Although the former represents only 3% of total capacity, then, this still equals “staggering amounts of capacity” (Telegeography, 2004, p. 73), well in excess of current demand levels.
The cities present in table 10 show logical similarities with those in the tables of the previous section, although the hierarchy is far from being the same. Frankfurt jumps from being sixth in terms of network presence and eighth for binary links to other cities to first here, whereas the most networked and linked city in the previous section, Hamburg, is only sixth for lit bandwidth. The presence of Copenhagen here in fourth position is surprising as it was outside the top ten for networks and connections. By contrast, Bremen is not even in the top thirty European cities for lit bandwidth, having been in the top ten for networks and connections. Clearly, in some cases, the networks of a city have had relatively limited amounts of lit bandwidth compared to other cities with perhaps fewer networks.
Despite these differences in hierarchy, the proportional measure in table 10 indicates that many cities have a high proportion of the total lit bandwidth of the top city Frankfurt. Dusseldorf still has 75% of the lit bandwidth of Frankfurt, and even Malmo in 29 th position has exactly 50%. Figure 6 shows the high proportional bandwidth connectivity of European cities compared to the overall top city.
Figure 6 – Ranked bandwidth connectivity of European cities
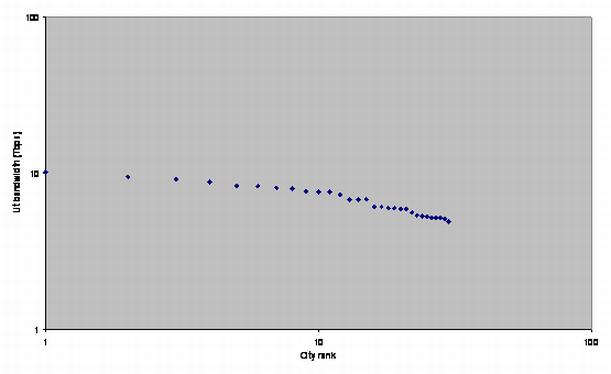
Source: abstracted from Telegeography (2004)
Table 11 – Top 10 European cities for international circuit usage
Rank |
Me tro area |
2003 international circuit usage per metro area (Gbps) |
Proportional to highest |
1 |
London |
620 |
1 |
2 |
Paris |
450 |
0.73 |
3 |
Frankfurt |
357 |
0.58 |
4 |
Amsterdam |
312 |
0.5 |
5 |
Copenhagen |
166 |
0.27 |
6 |
Stockholm |
149 |
0.24 |
7 |
Milan |
135 |
0.22 |
8 |
Brussels |
119 |
0.19 |
9 |
Madrid |
98 |
0.16 |
10 |
Zurich |
90 |
0.15 |
Source: Telegeography (2004)
Table 11 shows the top ten European cities for international circuit usage, as both a gross score and as a proportion of the highest individual score. International circuit usage refers to bandwidth used for overseas Internet, voice and other communications. Just as there was a great distinction between lit and unlit bandwidth for network supply, it is notable here that actual use of bandwidth also represents only a small percentage of lit bandwidth. For example, table 10 showed that Frankfurt has 10.2 Tbps of lit bandwidth, yet table 11 illustrates that only 357 Gbps (gigabits per second – a billion bits per second) of this is actually used for international communications, i.e. not even 5% of supply.
It is not surprising that the cities present in table 11 are largely similar to those which were present in table 10, but the two tables are not the same. London and Paris pass in front of Frankfurt, while Amsterdam jumps ahead of Copenhagen. Three German cities drop outside the top ten ( Berlin, Hamburg and Dusseldorf), to be replaced by Milan, Madrid and Zurich. This indicates that network usage is relatively closer to supply levels in the cities rising in the rankings, compared to those cities falling in the rankings.
A major difference between supply and usage of bandwidth networks can be discerned in the proportional measures. Figure 7 highlights how among the top European cities for telecoms, there is more variation in terms of usage than in terms of supply. Whilst the 10 th ranked city for lit bandwidth ( Dusseldorf) still had 75% of that of the top city (Frankfurt), the 10 th ranked city for international circuit usage ( Zurich) has only 15% of that of the top city ( London). There were 28 European cities that had at least half the proportional lit bandwidth of Frankfurt, the top city. There are, however, only 3 cities that have at least half the proportional international circuit usage of London.
Figure 7 – Ranked international circuit usage of European cities
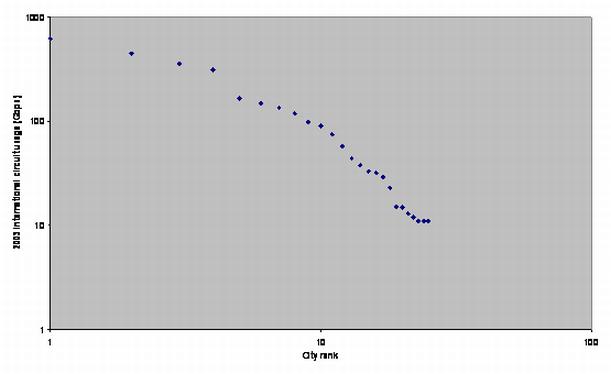
Source: abstracted from Telegeography (2004)
In the previous two sections, we began to analyse in some detail the technological connectivities of European cities using two resources of network supply and network usage data. We were able to highlight which cities appear to regionally dominate the world city network on these measures. But how do these results for technological connectivities compare to the ‘global network connectivity’ of European cities as calculated by the GaWC group?
Table 12 – ‘Global network connectivities’ of the top ten European cities
|
City |
Absolute GNC |
Relative GNC |
1 |
London |
63399 |
1 |
2 |
Paris |
44323 |
0.70 |
3 |
Milan |
38265 |
0.60 |
4 |
Madrid |
37690 |
0.59 |
5 |
Amsterdam |
37414 |
0.59 |
6 |
Frankfurt |
35964 |
0.57 |
7 |
Brussels |
35321 |
0.56 |
8 |
Zurich |
30737 |
0.48 |
9 |
Stockholm |
28185 |
0.44 |
10 |
Prague |
27493 |
0.43 |
Source: The data were produced by P.J. Taylor and constitute Data Set 12 of the GaWC Study Group and Network (http://www.lboro.ac.uk/gawc/) publication of inter-city data.
Table 12 shows the absolute and relative ‘global network connectivities’ (GNC) of the top ten cities in Europe, as calculated by Peter Taylor and his colleagues at Loughborough. London, as the most connected city in the whole network, is given a relative value of 1, as all other cities are measured against it. We can note that Paris is comfortably in second place, but that beyond this, there is a cluster of cities which have quite similar GNCs.
Figure 8 – Comparing ranks of ‘global network connectivities’ and KMI total connectivity (Rs = 0.550)

Figure 8 plots the 83 cities which we can rank on both GaWC GNC and KMI total connectivity measures in order to offer an initial comparison of ‘economic connectivities’ and ‘technological connectivities’ of European cities. Using the Spearman Rank Correlation technique produces a reasonably strong positive correlation (Rs = 0.550 – significant at the 0.01 level) between the two variables. The graph highlights, nevertheless, the relatively lowly position of Hamburg and Dusseldorf on the GaWC rank compared to their ranks of 1 and 2 respectively for telecoms connectivity. Conversely, the relatively high GaWC rankings of Prague, Warsaw, Lisbon and Budapest contrast with much lower telecoms connectivity rankings.
Figure 9 – Comparing ranks of ‘global network connectivities’ and Telegeography lit bandwidth (Rs = 0.758)

In a similar fashion, figure 9 plots cities ranked by GaWC GNC and by Telegeography lit bandwidth measures. Using the Spearman Rank Correlation technique produces a strong positive correlation (Rs = 0.758 – significant at the 0.01 level) between the two variables, indicating more of a relation between ‘economic connectivities’ and actual lit bandwidth than for the telecoms supply variable in figure 8. Here, Frankfurt, Copenhagen and Berlin are, nevertheless, notable outliers due to their lower ranks for GaWC than for Telegeography. In contrast, Milan, Madrid and Barcelona rank higher on ‘economic connectivity’ than on bandwidth connectivity.
Figure 10 – Comparing ranks of ‘global network connectivities’ and Telegeography international circuit usage (Rs = 0.721)
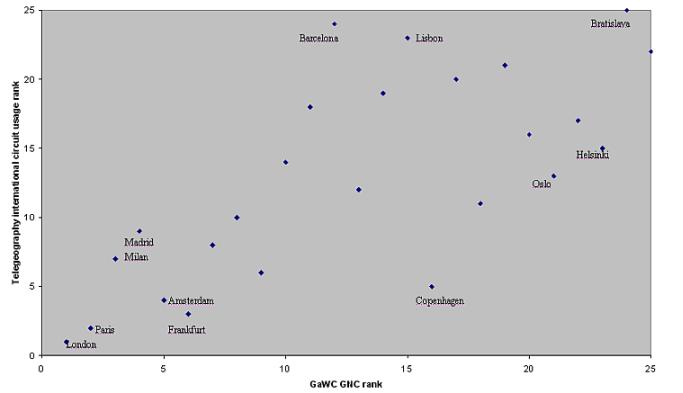
Figure 10 plots the GaWC GNC ranks and Telegeography network usage ranks. Using the Spearman Rank Correlation technique produces a strong positive correlation (Rs = 0.721 – significant at the 0.01 level) between the two variables, similar to that in figure 9, which confirms, therefore, the greater relationship between ‘economic connectivities’ and telecoms demand/usage connectivities than the telecoms supply connectivity variable in figure 8. Here, London and Paris, for example, rank first and second respectively on both measures. Only Copenhagen and Barcelona appear as very notable outliers, with the former being much lower, and the latter much higher, on the GaWC rank than the Telegeography rank.
Figure 11 – Comparing relative ‘global network connectivities’ and KMI total connectivity
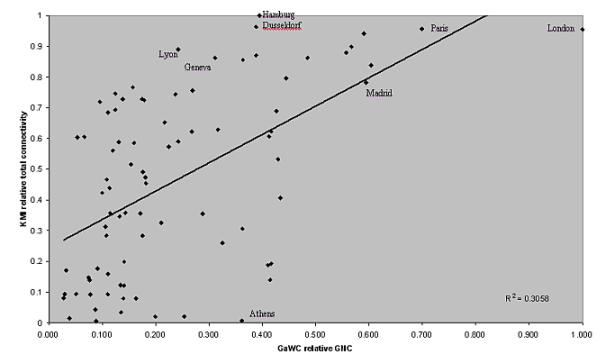
Figure 11 plots and compares the relative (or proportional to highest) city values for the GaWC GNC measure and KMI connectivity measure. Whilst the correlation between the two measures is rather weak (the R² value is 0.3058), the higher relative values for cities in telecoms connectivity over ‘economic connectivity’ are apparent, with a large gap between London and Paris on ‘x’ axis values. Hamburg and Dusseldorf are notable here for having proportional GNCs of less than 0.5 that of the highest city ( London), whilst having very high relative telecoms connectivity values.
Figure 12 – Comparing relative ‘global network connectivities’ and Telegeography lit bandwidth
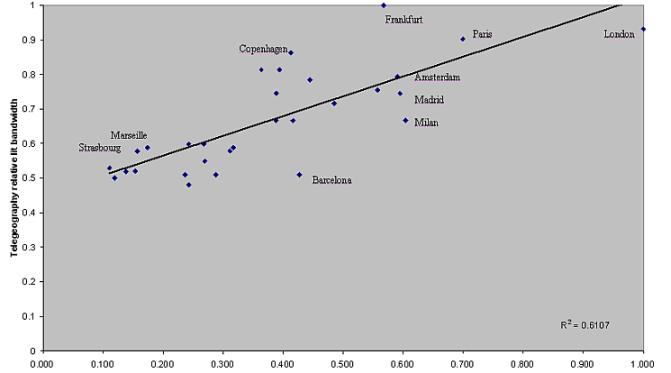
Figure 12 plots and compares the relative (or proportional to highest) city values for the GaWC GNC measure and Telegeography lit bandwidth measure. Moving from the pure telecoms supply measure of figure 11 to one offering here an initial indication of demand levels (met by supply of lit bandwidth) leads to a much stronger correlation with the GaWC measure (the R² value is 0.6107). In addition, the relatively high technological and economic connectivities of London and Paris are again apparent. In contrast, Frankfurt’s highest value for lit bandwidth is not replicated by a lower relative GNC value of under 0.6. Marseille and Strasbourg are also interesting cases, as they have a relative technological connectivity of around 0.6 compared to a much lower relative economic connectivity of less than 0.2.
Figure 13 – Comparing relative ‘global network connectivities’ and Telegeography international circuit usage
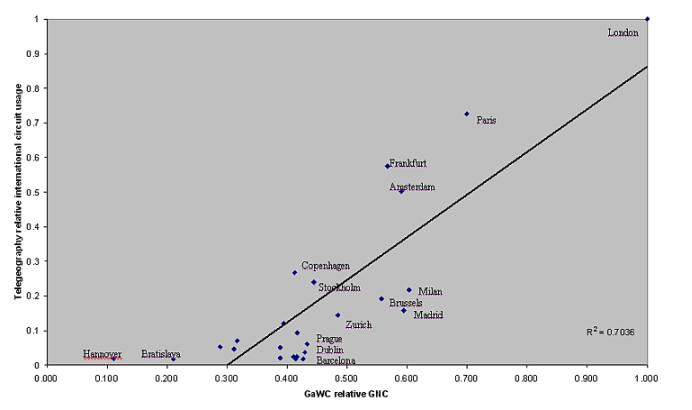
Figure 13 plots and compares the relative (or proportional to highest) city values for the GaWC GNC measure and Telegeography network usage measure. The greater degree of concentration on this network usage measure compared to the previous telecoms measures is clear in the graph, with only 3 cities having relative usage values above 0.3 of the top city, London. The R² value for this graph is the highest of the three comparisons of relative city values, suggesting that there is greater correlation between the GNC measure and the international telecoms usage measure than the two preceding measures of supply (figure 11) and anticipated demand (figure 12).
If we use these graphs as a summary of our attempt at comparing the technological and economic connectivities of European cities, it is possible to tentatively group cities into four categories, depending on how they rank comparatively on the two relational measures. Table 13 suggests that, as can be best seen in figure 13, there are clearly four cities with a high level of both technological and economic connectivity ( London, Paris, Amsterdam and Frankfurt). Other cities also show proximity in their degrees of technological and economic connectivity, but on a slightly lower level. We identify these cities (such as Brussels, Zurich, Stockholm and Vienna) as being the secondary techno-economic global service centres of Europe. Then there are those cities which appear to have higher economic connectivities than technological connectivities, and vice versa. These global service centres and technological nodes/gateways (which include notably a number of cities beyond the European core) are evidence that the links between economic and telecommunication connections are not direct and straightforward. Cities can be service centres of the global economy without the highest levels of telecommunications connections, while a high degree of relational linkage to other cities via shared office networks is not the only factor underpinning technological links.13 Given the tendency for explanatory hyperbole in some accounts of the links between economic development and communications technologies, these more measured findings appear to us to be important as we explore in more complex ways the place of various types of inter-city relations in the restructuring of the global economy.
Table 13 – The ‘spatial order’ of European cities’ techno-economic connectivities
The primary techno-economic global service centres of Europe |
London , Paris, Amsterdam, Frankfurt |
The secondary techno-economic global service centres of Europe |
Brussels , Zurich, Stockholm, Vienna
|
Global service centres (cities ranked higher for economic connectivities compared to technological connectivities) |
Milan , Madrid, Prague, Dublin, Barcelona
|
Technological nodes/gateways (cities ranked higher for technological connectivities compared to economic connectivities) |
Copenhagen , Hamburg, Dusseldorf, Berlin |
Many analyses of European spatial development have tried to move away from the stereotypical notion of a ‘blue banana’ of urban economic prosperity stretching from south east England to northern Italy (Taylor and Hoyler, 2000). For example, Michael Wegener talks instead of a ‘bunch of grapes’ representing possibilities for polycentric territorial development (Wegener, 1995), while John Goddard humorously depicted the situation as resembling more of a ‘fruit salad’ than any particular individual fruit (Goddard, 1995). Nevertheless, our analysis of ‘technological connectivities’ of European cities does highlight a renewed core focus (the ‘virtual blue banana’?) with some more peripheral cities in Europe being notably less connected to their counterparts. What is more interesting though is the notably different form of this ‘virtual blue banana’ compared to its predecessor. We suggest that the most technologically connected cities in Europe are concentrated in an axis running from the south west ( Madrid) to the north east ( Stockholm), which is wide enough to encompass London on one side and Milan, Munich and Berlin on the other. The major reason for this appears to be the relative importance of ‘gateway cities’ for funnelling telecommunications connections into more peripheral regions of Europe ( Iberian peninsula, Nordic regions, eastern Europe) (see Rutherford et al, 2004).
Peter Taylor has remarked how writers like Castells observed the peculiar position of Europe in world city formation with many relatively small cities (in global terms, e.g. Amsterdam and Frankfurt) having very important global functions (Taylor, 2003a; see Castells, 1993). Taylor has shown how this is the case empirically using relational measures, and our findings corroborate this as Amsterdam and Frankfurt are among the cities with the highest ‘technological connectivities’ in the European section of the world city network.
This paper has explored some of the possibilities of using existing data on telecommunications network connections and flows between cities as a measure of world city network formation. As a major proportion of the flows and linkages between offices of producer service firms (as measured and analysed in the work of the GaWC group) are constituted by inter-city telecommunications exchanges, it was argued that further study of the latter might begin to shed light on how exactly the world city network (and its relational economic power) is materially constructed through these electronic flows. Despite important limitations in data availability, we were able to offer some preliminary comparisons between our measures of the relational ‘technological connectivities’ of European cities and GaWC measures of the ‘global network connectivities’ of these cities.
Developing further this world city network perspective on the technological connectivities of cities will require the uncovering of more detailed and more globally-oriented telecommunications data. Ideally, such data would concern actual telecoms demand and usage within and between cities, as an important finding from our comparisons of technological and economic connectivities of cities in section 7 was that as we moved from supply measures to demand and usage measures, then the correlation between the technological and economic connectivities of cities became stronger. Given how substantial network overcapacity between European cities has become in recent years, data on raw telecoms supply clearly has only limited utility with regard to shedding light on actual telecoms use.
In the near future, however, it is likely that our desire for additional and improved data on information and communications flows between cities will remain part of Smith and Timberlake’s (1995) ‘wish list’ for world cities research resources. For reasons outlined in the paper, available supply- and demand-side telecoms data is far from ideal. We shall, nevertheless, continue our search for relevant data and be looking to continue to rework, improve and extend the inter-city relational analyses presented here. For example, it may be possible to undertake more detailed geographical analyses of ‘technological connectivities’ using a number of standard network analytical tools like clique and block analyses (following Shin and Timberlake, 2000, Taylor, Walker et al, 2002, Derudder and Taylor, 2003, and others). In addition, we should also be looking to compare our results for ‘virtual connectivities’ with other types of physical connectivity, such as those constituted by airline passenger flows (Derudder, Vereecken and Witlox, 2004; Witlox, Vereecken and Derudder, 2004).
One of the most interesting findings of this research from a world city network perspective has been to illustrate the inherent importance of inter-city relations to telecommunications network construction. It is revealing that providers have, most frequently, designed and built out networks in Europe using ‘ring’ architectures that always totally inter-link the cities where they are present, and offer the same capacities for hooking into the networks and the total bandwidth deployed throughout the ‘ring’ wherever one may be (see also Rutherford, 2005). This is undoubtedly a result of the demands of large firms for ‘end-to-end’ communications solutions which link up their offices in a number of cities with similar amounts of bandwidth. Quite what this means for geography is another question. The important issue may be whether a city is or is not on a network, rather than its relative position within the network. In this case, our initial analysis in section 5 of network presence and connections based on the KMI data becomes crucial.
In parallel, however, with this search for and analysis of better telecommunications data from a world city network perspective (especially ‘global’ data which shows links between cities in different regions), we would argue that it is crucial not to lose sight of the fact that these communications infrastructures are not just flow-based webs between urban nodes, but are conceived, designed and deployed in material place s. As Aoyama and Sheppard remind us:
“Research on networks, for example, has brought new ways of thinking about place and geographic relationships in the information age. Yet the danger exists of focusing too much on the network itself, neglecting to analyze forces on the ground that drive the very shape, structure, and relationships of networks, with the consequence that geographic places are increasingly understood simply as serving as nodes and hubs of global networks. Recognizing that network spaces are themselves internally differentiated, and their structures are shaped by geographical processes, can restore balance to the analysis by recognizing that virtual space is also shaped by geographic space” (Aoyama and Sheppard, 2003, p. 1152).
In this research, the existence of geographically and culturally differentiated ‘blocks’ of telecoms network connectivity among European cities, shown most clearly in figures 4 and 5, was one such manifestation of this importance in delving beyond the network level and looking for place-based dynamics and practices tied into the varying technological connectivities present between cities. These ever-present ties between the space of places and the space of flows need to be uncovered in more detail. This paper has focused essentially on networks and flows in virtual global space, in order to shed light on the underexamined nature of electronic connections between world cities and to highlight the importance of ‘technological connectivities’ to the emergence of a world city network ‘under conditions of contemporary globalisation’. At the same time, however, we stress the importance of remembering that such connections and connectivities remain spatially diverse and are inherently bound up with and shaped by a host of territorially specific regulatory, socio-economic, political and cultural contexts and dynamics, which have, if anything, gained rather than lost pertinence in our globalising age (Rutherford, 2004; 2005; see also Varsanyi, 2000; Brenner and Theodore, 2002).
We wish to thank Tim Stronge of Telegeography and Peter Taylor of the GaWC group for providing the data upon which much of the analysis in this paper was based.
Alderson, A. and Beckfield, J. (2004) Power and position in the world city system, American Journal of Sociology, 109, pp. 811-851.
Aoyama, Y. and Sheppard, E. (2003) The dialectics of geographic and virtual space, Environment and Planning A, 35, pp.1151-1156.
Beaverstock, J., Smith, R. and Taylor, P. (2000) World-city network: a new metageography?, Annals of the Association of American Geographers, 90(1), pp.123-134.
Begg, I. (1999) Cities and competitiveness, Urban Studies, 36(5-6), pp.795-809.
Brenner, N. and Theodore, N. (2002) Cities and the geographies of 'actually existing neoliberalism', Antipode, 34, pp.349-379.
Castells, M. (1993) European cities, the informational society, and the global economy, Tijdschrift voor Economische en Sociale Geografie, 84, pp.247-257.
Castells, M. (1996) The Information Age: Economy, Society and Culture Volume I - The Rise of the Network Society. Oxford, Blackwell.
Cattan, N. (1995) Attractivity and internationalisation of major European cities: the example of air traffic, Urban Studies, 32(2), pp.303-312.
Cheshire , P. (1990) Explaining the recent performance of the European Community’s major urban regions, Urban Studies, 27, pp.311-333.
Derudder, B. and Taylor, P. (2003) The cliquishness of world cities, Global Networks, 5(1), pp.71-91.
Derudder, B., Taylor, P., Witlox, F. and Catalano, G. (2003) Hierarchical tendencies and regional patterns in the world city network: a global urban analysis of 234 cities, Regional Studies, 37(9), pp.875-886.
Derudder, B., Vereecken, L. and Witlox, F. (2004) An appraisal of the use of airline data in assessments of the world city network, GaWC Research Bulletin, 152.
Friedmann, J. (1986) The world city hypothesis, Development and Change, 17, pp.69-83.
Friedmann, J. (1995) Where we stand: a decade of world city research, in Knox, P. and Taylor, P. (Eds.) World Cities in a World-System, Cambridge, Cambridge University Press, pp.21-47.
Friedmann, J. (2001) Intercity networks in a globalizing era, in Scott, A. (Ed.) Global City-Regions: Trends, Theory, Policy, Oxford, Oxford University Press, pp.119-136.
Friedmann, J. and Wolff, G. (1982) World city formation: an agenda for research and action, International Journal of Urban and Regional Research, 6, pp.309-344.
Goddard, J. (1995) Information and communications technologies, corporate hierarchies and urban hierarchies in the new Europe, in Brotchie, J., Batty, M., Blakely, E., Hall, P. and Newton, P. (Eds.) Cities in Competition: Productive and Sustainable Cities for the 21st Century, Melbourne, Longman Australia, pp.127-138.
Godfrey, B. and Zhou, Y. (1999) Ranking world cities: multinational corporations and the global urban hierarchy, Urban Geography, 20(3), pp.268-281.
Graham, S. (1999) Global grids of glass: on global cities, telecommunications and planetary urban networks, Urban Studies, 36(5-6), pp.929-949.
Graham, S. (2000) Constructing premium network spaces: reflections on infrastructure networks and contemporary urban development, International Journal of Urban and Regional Research, 24(1), pp.183-200.
Grubesic, T. and Murray, A. (2005) Geographies of imperfection in telecommunication analysis, Telecommunications Policy, 29, pp.69-94.
Hall, P. (2001) Christaller for a global age: redrawing the urban hierarchy, GaWC Research Bulletin, 59.
Hugill, P. (1999) Global Communications Since 1844: Geopolitics and Technology . Baltimore: The Johns Hopkins University Press.
Jones, A. (2002) The 'global city' misconceived: the myth of 'global management' in transnational service firms, Geoforum, 33, pp.335-350.
Keeling, D.J. (1995) Transportation and the world city paradigm, in Knox, P. and Taylor, P. (Eds.) World Cities in a World-System, Cambridge, Cambridge University Press, pp.115-131.
Langdale, J.V. (1991) Telecommunications and international transactions in information services, in Brunn, S. and Leinbach, T. (Eds.) Collapsing Time and Space, London: HarperCollins Academic, pp.193-214.
Lever, W. (1993) Competition within the European urban system, Urban Studies, 30(6), pp.935-948.
Lever, W. (1999) Competitive cities in Europe, Urban Studies, 36(5-6), pp.1029-1044.
Malecki, E. (2002) The economic geography of the Internet’s infrastructure, Economic Geography , 78, pp.399-424.
Malecki, E. and Gorman, S. (2001) Maybe the death of distance, but not the end of geography: the Internet as a network, in Leinbach, T. and Brunn, S. (Eds.) Worlds of E-Commerce: Economic, Geographical and Social Dimensions . Chichester: John Wiley & Sons.
Mattelart, A. (1994) Mapping World Communication: War, Progress, Culture, Minneapolis: University of Minnesota Press.
Mattelart, A. (1999) Mapping modernity: utopia and communications networks, in Cosgrove, D. (Ed.) Mappings, London, Reaktion Books, pp.169-192.
Mattelart, A. (2000) Networking the World, 1794-2000, Minneapolis: University of Minnesota Press.
Moss, M. (1987) Telecommunications, world cities, and urban policy, Urban Studies, 24, pp.534-546.
O'Connor, K. (1995) Change in the pattern of airline services and city development, in Brotchie, J., Batty, M., Blakely, E., Hall, P. and Newton, P. (Eds.) Cities in Competition: Productive and Sustainable Cities for the 21st Century, Melbourne, Longman Australia, pp.88-104.
O’Kelly, M. and Grubesic, T. (2002) Backbone topology, access and the commercial Internet, 1997-2000, Environment and Planning B: Planning and Design ,29, pp.533-552.
Pumain, D. (1992) Urban networks or urban hierarchies?, Environment and Planning A, 24, pp.1377-1380.
Rimmer, P. (1998) Transport and telecommunications among world cities, in Lo, F. and Yeung, Y. (Eds.) Globalization and the World of Large Cities, Tokyo, United Nations University Press, pp.433-470.
Rutherford, J. (2004) A Tale of Two Global Cities: Comparing the Territorialities of Telecommunications Developments in Paris and London. Aldershot, Ashgate.
Rutherford, J. (2005) Networks in cities, cities in networks: territory and globalisation intertwined in telecommunications infrastructure development in Europe, Urban Studies, 42(13), forthcoming.
Rutherford, J., Gillespie, A. and Richardson, R. (2004) The territoriality of pan-European telecommunications backbone networks, Journal of Urban Technology, 11(3), pp.1-34.
Sassen, S. (1991) The Global City: New York, London, Tokyo . Princeton: Princeton University Press.
Schiller, D. (1999) Digital Capitalism: Networking the Global Market System. London, MIT Press.
Shin, K-H. and Timberlake, M. (2000) World cities in Asia: cliques, centrality and connectedness, Urban Studies , 37, pp.2257–85.
Short, J.R., Kim, Y., Kuus, M. and Wells, H. (1996) The dirty little secret of world cities research: data problems in comparative analysis, International Journal of Urban and Regional Research, 20, pp.697–717.
Smith, D. and Timberlake, M. (1995) Cities in global matrices: toward mapping the world-system’s city system, in Knox, P. and Taylor, P. (Eds.) World Cities in a World System, Cambridge: Cambridge University Press, pp.79-97.
Smith, D. and Timberlake, M. (2002) Hierarchies of dominance among world cities: a network approach, in Sassen, S. (Ed.) Global Networks, Linked Cities, London, Routledge, pp.117-141.
Standage, T. (1998) The Victorian Internet: The Remarkable Story of the Telegraph and the Nineteenth Century’s Online Pioneers, London: Weidenfeld & Nicolson.
Taylor , P. (1996) Embedded statism and the social sciences: opening up to new spaces, Environment and Planning A , 28, pp.1917-1928.
Taylor , P. (1997) Hierarchical tendencies amongst world cities: a global research proposal, Cities, 14(6), pp.323-332.
Taylor , P. (2000) Embedded statism and the social sciences 2: geographies (and metageographies) in globalization, Environment and Planning A, 32, pp.1105-1114.
Taylor , P. (2001) Specification of the world city network, Geographical Analysis, 33(2), pp.181-194.
Taylor , P. (2003a) European cities in the world city network, in van Dijk, H. (Ed.) The European Metropolis 1920-2000, Rotterdam, Erasmus Universiteit.
Taylor , P. (2003b) World City Network: A Global Urban Analysis. London, Routledge.
Taylor , P., Catalano, G. and Walker, D. (2002a) Measurement of the world city network, Urban Studies, 39(13), pp.2367-2376.
Taylor, P., Catalano, G. and Walker, D. (2002b) Exploratory analysis of the world city network, Urban Studies, 39(13), pp.2377-2394.
Taylor , P. and Derudder, B. (2004) Porous Europe: European cities in global urban arenas, Tijdschrift voor Economische en Sociale Geografie, 95(5), pp.527-538.
Taylor, P. and Hoyler, M. (2000) The spatial order of European cities under conditions of contemporary globalisation, Tijdschrift voor Economische en Sociale Geografie, 91(2), pp.176-189.
Taylor , P., Walker, D. and Beaverstock, J. (2002) Firms and their global service networks, in Sassen, S. (Ed.) Global Networks, Linked Cities, London, Routledge, pp.93-115.
Taylor, P., Walker, D., Catalano, G. and Hoyler, M. (2002) Diversity and power in the world city network, Cities, 19(4), pp.231-241.
TeleGeography (2004) International Bandwidth – Volume 2: Terrestrial Networks, Washington DC, PriMetrica, Inc.
Thrift, N. (1996) New urban eras and old technological fears: reconfiguring the goodwill of electronic things, Urban Studies, 33(8), pp.1463-1493.
Townsend, A. (2001) The Internet and the rise of the new network cities: 1969-1999, Environment and Planning B: Planning and Design , 28, pp.39-58.
Varsanyi, M. (2000) Global cities from the ground up: a response to Peter Taylor, Political Geography, 19, pp.33-38.
Wegener, M. (1995) The changing urban hierarchy in Europe, in Brotchie, J., Batty, M., Blakely, E., Hall, P. and Newton, P. (Eds.) Cities in Competition: Productive and Sustainable Cities for the 21st Century, Melbourne, Longman Australia, pp.139-160.
Wheeler, D. and O’Kelly, M. (1999) Network topology and city accessibility of the commercial Internet, Professional Geographer , 51, pp.327-339.
Witlox, F., Vereecken, L. and Derudder, B. (2004) Mapping the global network economy on the basis of air passenger transport flows, GaWC Research Bulletin, 157.
Zook, M. and Brunn, S. (2004) From podes to antipodes: new dimensions in mapping global time, cost, and distance, paper presented at the Specialist Workshop on Globalization in the World-System: Mapping Change over Time, University of California, Riverside.
*Jonathan Rutherford, Laboratoire Techniques Territoires Sociétés (LATTS), Ecole Nationale des Ponts et Chaussées (ENPC), 6-8 avenue Blaise Pascal, F-77455 Marne-la-Vallée cedex 2, France. Fax +33 (0)1 64 15 36 00 Email jonathan.rutherford@enpc.fr (corresponding author)
**Andy Gillespie and Ranald Richardson, Centre for Urban and Regional Development Studies (CURDS), University of Newcastle, Claremont Bridge, Newcastle-upon-Tyne, NE1 7RU, UK. Fax +44 (0)191 2329259 Email andy.gillespie@ncl.ac.uk and ranald.richardson@ncl.ac.uk
1 The Globalization and World Cities study group and network, co-directed by Peter Taylor and Jon Beaverstock at Loughborough University, encompasses wide-ranging work into the urban manifestations of globalisation processes by researchers across the globe (see http://www.lboro.ac.uk/gawc/index.html).
2 Work by Moss (1987), Langdale (1991), Goddard (1995), Rimmer (1998) and Graham (1999) constitute rare examples of that which has broadly examined the development of global telecommunications networks in relation to world cities literatures, albeit without engaging in any detailed empirical analysis. However, as Rimmer discovered, available global traffic data tends to have an international, rather than inter-city, format, meaning, for example, that we might know how much traffic flows between the UK and France, but not between London and Paris, or for that matter between two US world cities. Although recent work on the geographies of Internet backbone networks does focus on inter-city connections on the supply-side, most frequently this is at best only related to creating urban hierarchies of telecommunications access (‘network cities’), and not to the economic flows between cities which are supported by and reinforce electronic networks.
3 This production of parallel technological and economic connectivities has, nevertheless, been an important feature of the development of western cities, societies and territorialities since the late eighteenth century when the visual telegraph was deployed across post-revolutionary France. In particular, the intensive global networking and colonial power extensions of the nineteenth century were undoubtedly mutually dependent on the construction and sustaining of technological and economic flows and relations (Mattelart, 1994; 1999; 2000; Standage, 1998; Hugill, 1999; Thrift, 1996).
4 Reviewed in some detail by Friedmann himself (see Friedmann, 1995; 2001).
5 As Derudder, Vereecken and Witlox suggest: “Only data that come in the form of inter-city matrices are able to unravel the spatiality behind overall connectivity” (Derudder, Vereecken and Witlox, 2004).
6 As well as providing the physical infrastructures upon which the world city network is constituted and continuously reproduced, inter-city communications networks and flows also provide a paradoxical external relational base to individual cities in an increasingly competitive interurban environment (Begg, 1999; Lever, 1999). Although nobody seems to know how important communications networks and connections are for the economic development of cities and competitiveness of firms based there, we can safely assume that in order to attract and retain many types of global businesses, high quality access to these networks and connections is of primary importance. How paradoxical then that economic development and competitiveness in this regard relies on a city having multiple links with its ‘competitors’. Without wishing to reify cities, processes and practices of competition and cooperation between (agencies and organisations of) cities appear to be, in effect, virtually two sides of the same coin.
7 See Grubesic and Murray (2005) for a more detailed exploration of methodological and data ‘imperfections’ in telecommunications analysis.
8 The project for which the data set was obtained (ESPON project 1.2.2) had also an exclusively European focus.
9 Both KMI and Telegeography have kindly granted permission for us to use their resources for the research presented in this paper.
10 It should be noted that, at this point in time (2001), the downturn in the global telecommunications market is not yet reflected in the map, nor therefore in our data matrix, which thus illustrate the European network connectivity situation at the ‘high water mark’ of the technology boom. Although this may exaggerate slightly the quantitative level of network connections, we suggest that our data still reflects well the qualitative types and directions of connections between cities
11On a slightly lesser scale, Amsterdam is also ‘underconnected’ (only 3 inward vectors) relative to the number of provider networks present there (17).
12Notably, since the mid-1980s when the UK telecommunications market gradually opened up, London has been the ‘landing point’ on the European continent for the networks and operations of many North American telecommunications providers, and the ‘launchpad’ for European providers wishing to deploy trans-Atlantic infrastructure. The level of technological connectivity between London and numerous North American cities, particularly on the east coast, is likely to be quite high as a result.
13 This latter point is most clearly supported by the absence from the GaWC list of global service connectivities of Bremen, Montpellier, Toulouse and Bielefeld, which are all highly networked cities for telecommunications infrastructure.
Edited and posted on the web on 25th October 2005