GaWC Research Bulletin 166 |
|
|
INTRODUCTIONMajor cities and their direct roles in global economy increasingly attract attention of practitioners and investigators. One of the most remarkable researching trends was initiated in the 1980ies early 1990ies by John Friedman (1986), Anthony D. King (1991) and Saskia Sassen (1991, 1994) whose studies were focused on global cities and their transnational relations. In 1999 Globalization and World Cities (GaWC) Research Group at Loughborough University (UK) launched the next stage of investigations in this field under the guidance by Peter J. Taylor. Alongside with theoretical conceptions GaWC innovated some quantitative methods of research and produced a huge empirical data. The basic method as described in GaWCs early publications (Taylor 2001; Taylor, Catalano and Walker 2002a) enables to calculate nodal size and connectivity values for any considerable city in global networks. Initially such values were computed for global inter-city network that is formed by banking, insurance, accounting, advertising and law corporations. Then GaWC studies embraced also network geography of architectural firms, media groups, non-governmental organizations (NGOs), etc. Besides, initial methods were supplemented by some other statistical procedures, mainly PCA (principal components analysis) (See for example: Taylor, Catalano and Walker, 2002b). Many of now existing results of these immense investigations (including economic, political, social and cultural globalization processes) are surveyed in recent article by P.J.Taylor (Taylor 2004c). Certainly, Taylors World City Network (Taylor 2004a) also should be named here. Meanwhile Arthur S. Alderson and Jason Beckfield at Indiana University in Bloomington, USA, elaborated another quantitative method, which was applied to corporate inter-city geography of almost 500 firms from The Fortune Magazines traditional ranking (Alderson and Beckfield 2004). Examining co-location of headquarters and subsidiaries, the authors operate by four measures, namely outdegree, indegree, closeness and betweenness centralities. Although Alderson and Beckfields techniques considerably differs from that of GaWCs, the results in both cases are quite reliable and relatively close, or comparable at least. (For detailed comparison of two methods see Taylor 2004b). Each of them reveals fundamental aspects of global economy; together they enable to measure and depict multi-dimensional universe of inter-city ties and relations. Now, just a few years since GaWCs pioneering activity has begun, there are some obvious and impressive achievements. Methodological experience and various data sets can be regarded as an empirical breakthrough in the sphere that was earlier predominated by theoretical and non-quantitative approach. Certainly, empirical materials in their own turn contribute to enrichment and further progress of theory. Nevertheless it should be noted again that the above-mentioned studies consider global networks where global firms and organizations operate, while non-global actors also could be taken into account. There is a multitude of medium-size corporations, which are deeply rooted in their own niches of world economy. Such firms often find their clients and open offices where Barclays Bank, BNP Paribas, Citigroup or Sumitomo have no direct interests and subordinated branches. Being many times smaller than global corporate giants, such medium-size firms are large enough to connect dozens of regionally important cities. So we can assume that the global inter-city network (now taken as a singular despite sectoral variations) is accompanied by many other networks of regional, national and even sub-national scale. Certainly such demarcation between global and non-global networks is not very strict and distinctive: a non-global firm can be closely tied with global ones via banking correspondence accounts, re-insurance mechanisms, franchising, outsourcing and so on, depending on a sector to consider. Besides, a city can be a very important location for both global and non-global firms, thus playing a gateway role. Nonetheless, it seems that in many cases non-global networks can be effectively regarded and examined as conditionally separated phenomena. If such analogy is appropriate, non-global inter-city networks can resemble regional, corporate and other specialized computer networks that provide their own data traffic. Additionally they are connected with global Internet by nodal computers like hosts or routers. Needless to say that such nodes and networks, especially the largest ones, alongside with Internet itself form a field of investigation for computer science. And now returning to economic sphere it is necessary to mention innovative investigations by E.C.Rossi and P.J.Taylor (Rossi and Taylor 2004a; 2004b) who probe Brazilian banking service. Examining domestic and foreign location strategies of Brazilian financial corporations, these authors have added a new dimension to previous studies. So there is a convincing and encouraging example of nationally focused analysis, which is based on GaWCs measuring methodology. The present article is an attempt to consider another non-global, but quite large and important inter-city network. THE BANKING SECTOR IN RUSSIAThere are several reasons to choose this very country and this very sector for new analysis of non-global network. Firstly, it is quite large, industrious and effectively organized system where billions of dollars circulate continuously. Although most of banks were founded only 12 15 years ago at the dawn of post-Soviet era, it isnt true to suppose an absence of national financial service tradition. Many St Petersburg and Moscow banks saw their golden age in the late 19th early 20th century, but it was rudely interrupted by the Communist revolution of 1917. For many decades national financial flows were under absolute governmental control. In the mid-1960ies the regime initiated very modest economic liberalization, including some important improvements in state-owned financial institutions. Since then many well-educated professional teams have appeared not only in Moscow and foreign branches of Russian banks, but also in major regional centres. Thousands of experienced administrators, accountants and analysts migrated to private banks when establishment of such institutions was allowed in the beginning of the 1990ies. Well-trained managers and personnel contributed to further progress of the sector during the post-Soviet period. Despite serious crises of 1995 and 1998, some new banks turned into large financial corporations, which are comparable with their Western counterparts by standards of advanced service producing and by engineering equipment. Now it is quite ordinary that Russian financial institutions participate in SWIFT, Reuters Dealing and card payment systems like American Express and Visa International. National banking sector, its various aspects and current developments are in focus of many studies by Russian scholars (Bratko 2001; Bukato, Golovin and Lvov 2001; Matovnikov 2000, etc.) and their foreign colleagues, especially David Lane at the University of Cambridge, UK (Lane 2001, 2002a, 2002b). Certainly, even the largest Russian banks are much smaller than gigantic global companies, but (according to The Banker Magazines rankings) they are obvious trans-regional leaders in Russia itself alongside with CIS and East European countries. It is even more important for the present analysis that the Russian banks operate in large country with considerable population, many cities and vast territory: so they need various offices that can be hundreds or thousands miles away from headquarters.. On the other hand (and that is the second reason) there is a kind of financial semi-isolation. Now Russia is the largest national economy outside the ranks of the World Trade Organization (WTO), including the General Agreement on Trade in Services (GATS) as one of WTOs pillars. There are some protectionist restrictions in national legislation. Foreign banks can establish affiliated corporations (up to 100%-share of major company) registered in Russia, but not subordinated offices under cross-border administration. Citibank, HSBC, ABN Amro, Deutsche Bank and other global corporations are represented in Russia as Moscow-registered affiliated firms using the same brands. It is very likely that situation will be quite different in the shortest time. Negotiations between Russia and WTO are in fast progress and many analysts believe that such restrictions will be abolished soon in parallel with Russias joining the Organization. Besides, even now there are highly developed external ties of other kinds, like banking correspondence relations, mutual participation of Russian and foreign banks in transnational syndicated credits, etc. But inter-city office linkages at present time are maintained by domestic financial institutions, so this network can be conditionally regarded as an isolated (at least for purposes of this study). Additionally, there would be a good chance to see dynamism of globalization: it will be interesting to compare present-day quantitative characteristics of this network and its future parameters after Russias entering to the WTO/GATS. Finally, one more point of preliminary explanations is necessary here. As it was mentioned above, most of GaWCs empirically-based studies embrace office networks of 100 global firms, which belong to various sectors of advanced service producing (namely banking, insurance, accounting, advertising and law corporations); such approach is in line with the earlier conception of Saskia Sassen (1991). The present publication is a bit different in this way for it considers banking sector alone. The author hopes that it is quite justified since this study is regarded as an initial attempt that can be followed by further investigations. Also it should be noted that in Russia banks have developed much more dense and ramified office networks than, for example, accounting or advertising firms have done. And now approaching methodological issues, it is necessary to add that investigation of similar objects simplifies some technical tasks, including filtration and ranking procedures. METHODOLOGY IThe present study is based principally on GaWCs ideas and techniques. The first researching stage is an analytical selection of firms and cities for further consideration. Then each city i should be ranked depending on its service value (vij) for each firm j, thus a general service value matrix (V) will be created. It could be followed by calculation of nodal size (Sa in Taylor 2004c, equation 1) or site service status (Ci in Taylor 2001, equation 3): Ci =
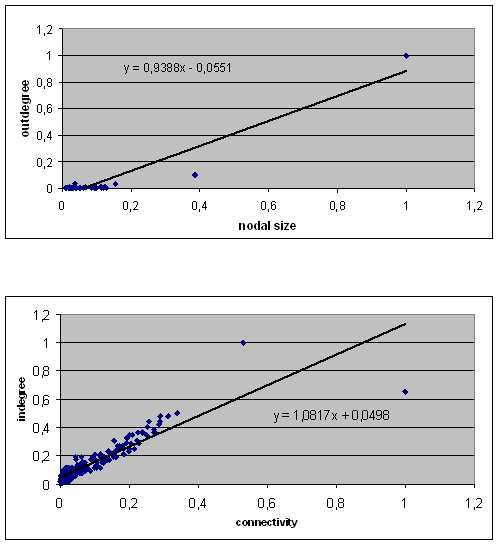
Σ vij (1) Another GaWCs standard formula (equations 4, 5 and 6 in Taylor 2001 or their combination in Taylor, Catalano and Walker 2002a) enables to compute nodal connection or network connectivity (Na) for any city a: Na = Σ Σ vaj . vij where a ? i (2) Most of GaWCs interlocking calculations are based on 316 (cities) x 100 (global service firms) matrix and its modifications (Taylor, Catalano and Walker 2002a, 2002b, 2004; Taylor and Catalano 2002; Derudder, Taylor, Witlox and Catalano 2003; Taylor 2004a, etc). In case of Brazilian studies the 55 x 31 matrix is used (Rossi and Taylor 2004a, 2004b). Certainly, the authors selected the most appropriate and significant institutions in accordance with global and national rankings. When examining Russian banking sector, any researcher also can rely upon generally recognized ranking lists, such as Top 200 quarterly tables in Moscow-based Expert Magazine. For purposes of this study 122 banks were selected. Each of them meets two requirements: (1) at least minimal inter-city corporative administration and (2) assets exceeding 2.5 billions of roubles by January 2003 (so these banks are considered as major or medium-size by Russian analysts). Such selection seems to be quite representative since these 122 institutions control about 80% of aggregated assets belonging to all 1,300 Russian financial corporations. Geography of office networks was examined through corporative web sites and analogous sources. Additionally, this information was verified via official quarterly bulletins, which are regularly published by the Bank of Russia. Various filtrations enabled to select 276 cities in all the sub-national regions from the Baltic Sea to the Pacific. The problem of service value estimation was simplified here because of homogeneity factor (one country and one sector). Certainly, the GaWC scale was taken as a model: 5 is scored for each headquarter, 2 is scored for normal office, etc. (Taylor, Catalano and Walker 2002a). Besides, standard terms, which are common things in practice of Russian financial administration (branch, additional office, agency and so on) enabled to use decimals in some cases for rectification of basic scores. As a result of these preliminary procedures the 276 (cities) x 122 (banks) value matrix was created. At the following stages nodal size and network connectivity values were computed for all the 276 cities in accordance with equations 1 and 2. Both measures can be expressed in absolute or in proportional form (i.e. as a proportion to the highest individual value (that of Moscow)). The results1 for 20 leading cities are given in Table 1. At the first glance there are no great surprises: almost all the major centres are here, while Moscow and St Petersburg are much more connected than the others, but Moscow is much more connected than St Petersburg. In general such situation positively correlates with GaWCs data on global banking connectivity. St Petersburgs value in the global ranking is 0.38 as a proportion to that of Moscow (0.19 and 0.5 respectively in Taylor 2003, Table 1). In Russian networks St Petersburgs value grows to 0.53 thus reflecting the citys high orientation to domestic, but not global linkages. Although other Russian cities are not represented in GaWCs global ranking at all, more detailed examination shows that there are some quite remarkable and important cases, which will be considered hereafter. Nevertheless, some preliminary generalizations and comparisons are possible even now. It is easy to note that almost every city (with just four exceptions, including Moscow and St Petersburg) takes different places in two parts of Table 1. The main reason for such mobility is a great gap between two financial metropolises and other major cities. Starting from the third position and looking further down we can see many close results. There are several pairs and trios of almost equal competitors with various advantages: some cities are higher by number and status of banking offices (e.g. Yekaterinburg) while other ones are involved into larger inter-city corporative networks (e.g. Kaliningrad). Another conclusion belongs to the sphere of transnational comparisons again. According to previous GaWC studies the total sum of individual nodal sizes for all the 316 global cities is 16,901 (Taylor, Catalano and Walker 2002a), i.e. 0.5348 per cell in the 316 x 100 matrix. In case of Russian banking service the sum in 276 x 122 matrix is 3,066 or 0.0911 for a cell in average. The same contrast can be seen after simple alteration of another data set. Since aggregated connectivity value for 316 global cities is 4,078,256 (Taylor, Catalano and Walker 2002a), an average connectivity is 12,906, which number by far exceeds 603 per city in Russian networks. Although these calculated differences are not good enough for direct collocation, they obviously reflect rather low density of inter-city linkages in Russian corporative networks as compared with their global analogs. Low density is accompanied by a relatively high centralization. Various GaWC studies taken in the aggregate enable to compare global and national (Brazilian and now also Russian) data sets of banking connectivities (Taylor and Catalano 2002 (Table 1); Rossi and Taylor 2004a (Table 4), 2004b). Needless to say that Russia and Brazil form a suitable pair for comparison since their population, GDP and some other quantitative characteristics are rather close. The results are shown here in a standard form of Lorenz curves for Top 20 cities where their contribution to total connectivity value is accumulating in succession (Figure 1). While global and Brazilian cities are visually close to theoretical line of perfectly regular accumulation, in Russia growth fastens at the upper levels. So Moscow is even a more important node for Russian service networks than Sao Paolo is for Brazilian ones. Certainly, at lower levels of these samples Tomsk, Izhevsk, Yaroslavl, Barnaul and Voronezh (No. 16 20 in Russia) are less important nationally than Blumenau, Joinville, Florianopolis, Sorocaba and Piracicaba (No. 16 20 in Brazil). Analogous conclusions are true for comparison between Russian and global cities. In spite of all these differences some Russian cities are significant financial centres, which are worthy of further consideration. It could be strictly in line with GaWC techniques of connectivity studies (in a forthcoming research) or in a slightly modified way (in the following sections of this article). METHODOLOGY IIAnother mode of data processing (or parallel path in Taylors words (Taylor 2004b)) was launched by A.S.Alderson and J.Beckfield at Indiana University in their above-mentioned study (Alderson and Beckfield 2004). Examining urban geography of global business the authors use four measures, while two of these measures are primary important for the present paper: outdegree and indegree centrality. Also such indicators can be interpreted as number of ties sent from a city and ties received by a city respectively. Alderson and Beckfield in their turn refer to equations in Wasserman and Fausts publication (Wasserman and Faust 1994), which are proper for investigation of various social networks: ׀ Xi + ׀ Xi + where CD is outdegree centrality of node (city) ni, PD is prestige (indegree centrality) of city ni, Xi + is a number of ties sent and number of ties received in these two formulas respectively and standardizing denominator g 1 renders these measures as proportions of ties sent or ties received to the maximal possible number of such linkages. Aiming to prevent calculated results that are greater than one Alderson and Beckfield employ raw, but not valued data (Alderson and Beckfield 2004, pp. 822, 824). In general, their method emphasizes vertical ties between headquarters and branches. Taking Fortunes Top 500 global ranking as a starting point the authors gathered data on 3,692 cities, including 125 cities where headquarters are situated. In the present paper Alderson and Beckfields method was employed2, but with a certain bias towards GaWCs toolkit. This study is based on valued data (since 50 Moscow-located banks has their branches in St Petersburg such situation is scored as 50 points, but not one; 24 Moscow-located banks, which are represented in Rostov add 24 more points for Moscow, etc.) 3. Besides, GaWCs mode of standardization is used here: all values were recalculated as proportions to the highest individual values (Moscow for outdegree and St Petersburg for indegree centralities). The results for 20 leading cities are given in Table 2, again in absolute and proportional forms. Since GaWCs and Alderson & Beckfields methods were applied to the same primary data set, direct quantitative comparison of these techniques is possible. The small Table below reports the results of such analysis in simple form of Pearsons linear correlation coefficients (Pearson r). Table: Correlations between results produced by GaWCs and Alderson & Beckfields methods
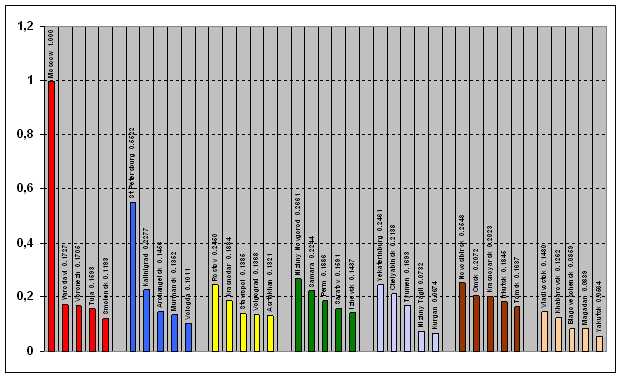
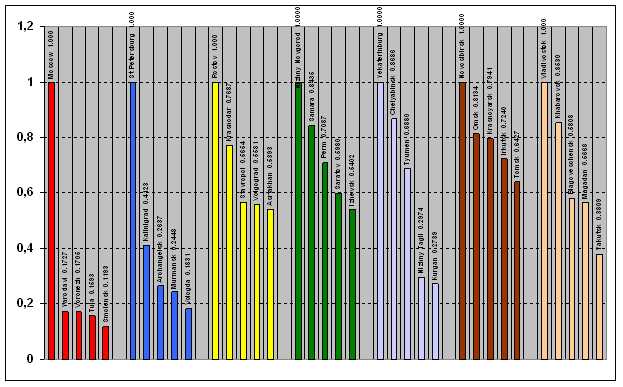
All results here are considerably greater than 0.6; it is usually interpreted as rather strong and positive correlation. Not only nodal sizes, but connectivity values also are remarkably close to outdegree and indegree centralities, in spite of considerable procedural difference. In two pairs (nodal size / indegree and connectivity / outdegree) somewhat lower coefficients can be explained by ousting effect: in (e.g.) Yekaterinburg, Chelyabinsk and Kazan local banks are strong enough to compete with non-local corporations thus slightly delaying their coming, while in Kaliningrad situation is the opposite. In two other pairs (nodal size / outdegree and connectivity / indegree) correlations are significantly stronger. Being grouped in this way the measures represent similar (although not absolutely coinciding) aspects of cities status: respectively, their sites and situations in Taylors terms (Table 3 in Taylor 2004c is initial example of such groupings). As to the case of Russian inter-city networks, Figure 2 depicts general results of such comparison for all the individual objects in two massifs. Certainly, such close results are noteworthy and encouraging. Various techniques enable to contribute effectively to similar analytical tasks. Different indicators can be used for investigation of cities advantages and disadvantages in different aspects of banking business. On the other hand, such variety of measures can be not enough convenient for summarized conclusions concerning individual cities and their combinations. In some cases generalizing indices can be preferable. Obviously the simplest way to produce such index is a calculation of arithmetic mean for all the four measures that were considered earlier. These four basic indicators (like four aspects of banking activity that are behind them) are treated as equally important, so weighting procedure is not necessary. Now turning into sub-indices they equally contribute to aggregated index of cities banking influence, as it is called here conditionally. Needless to say that the author considers it just as experimental mode of measurement without any aspirations for universalism or replacement of well-elaborated methods, which are employed already by other researchers. On the contrary, the present study is much indebted to above-mentioned techniques and publications. The results for the 20 largest centres of banking activity can be seen in Table 3. As in previous cases proportional values are calculated according to GaWCs principle: Moscow value, which is the highest, is taken as one. Deviations from cities positions in four other rankings are also shown. Once again such comparison illustrates some local facts like Kaliningrads highly developed connectivity, predictably great power of financial node in Yekaterinburg, etc. Nevertheless, it is obvious that maximal advantages could be gained if a city performs well in various spheres of banking activity simultaneously. Thus Yekaterinburg finally jumps over Kaliningrad in the aggregated ranking, but Nizhny Novgorod and Novosibirsk stand even higher because of their rather balanced and strong positions in four spheres represented by sub-indices. These examples as well as many other ones can be systematized not only in ranking tables, but also in a certain geographically distributed array. This very attempt will be made in the next section. GEOGRAPHICAL SURVEYAt present Russian Federation consists of 89 constitutionally based territories, which vary enormously in their areas, population numbers, gross regional products, economic specializations, geographical advantages and so on. Besides, some historical reasons caused multiplicity of official administrative titles like kray, oblast, avtonomny okrug, avtonomnaya oblast or even republic. In 2000 major administrative reform was initiated. Although retaining their statuses, constitutional territories are grouped now by seven Federal Districts, FDs (Federalnyie Okruga, FO in Russian) with their corresponding capitals: Central FD (Moscow), North West FD (St Petersburg), South FD (Rostov), Volga FD (Nizhny Novgorod), Urals FD (Yekaterinburg), Siberian FD (Novosibirsk) and Far East FD (Khabarovsk). In many ways this new mode of division was designed as a technical and administrative one. It doesnt coincide with traditional scheme of eleven economic regions, which is effectively used for many decades already. Nevertheless, newly established FDs are increasingly important not only in political sense, but also economically; so this format is an appropriate basis for successive geographical review of the most significant cities and their combinations from Central Russia to the Pacific coast. Central FD It is not a surprise to see maximal predominance of the only financial node at this territory. Moscow indisputably belongs to the range of highly significant world cities: this fact was empirically proved by various GaWCs methods (Beaverstock, Smith and Taylor 1999; Taylor, Catalano and Walker 2002a, 2002b; Taylor, Walker and Beaverstock 2002; Derudder, Taylor, Witlox and Catalano 2003; Taylor 2003, etc). Convincing examples of profound analysis touching the subject are also presented in publications by Olga Gritsai, Vladimir Kolosov, John OLoughlin and other researchers (Gritsai 1996, 1997a, 1997b, 1997c, 1997d, 2003, 2004, 2005; Gubanov 1999; Ioffe and Nefedova 1998; Kolosov 1997; Kolosov, Vendina and OLoughlin 2002; OLoughlin and Kolosov 2002, etc) So, Moscow has now appeared on the lists of world cities after three-quarters of a century isolated from the capitalist world economy (Kolosov, Vendina and OLoughlin 2002). With its 10,102,000 of inhabitants4 Moscow is even larger than other biggest cities of Europe, including London, Paris and Berlin. Today Moscows skyline is formed by many dozens of high-rising office buildings that visually emphasize the citys role as prime commanding centre for many industries and corporations. Moscow controls enormous share of Russias public and private finance. 75 banks of 122 in this study are registered there. The largest non-Moscow bank (PromstroyBank in St Petersburg) takes just the 11th place in ranking by assets, which is chosen as starting point in this complex of measurements. In fact Moscow is even more important than it can be concluded on the basis of calculations in this study. These figures show that Moscow is by far the largest node in nationally wide networks, while the city additionally plays role of the main gateway to global financial markets. Certainly, Moscow even more obviously dominates over the Central FD, than over the whole country. The closest inner-regional competitor is Yaroslavl (the 15th place in national ranking by aggregated indices / 613,000 of inhabitants / 270 km from Moscow5). It is followed by Voronezh (the 16th place / 849,000 / 530 km). Both cities are well known as important sub-regional centres: Yaroslavl at the Upper Volga and Voronezh in vast agricultural territory of Chernozemye (Black-soil Lands). Besides, Yaroslavl is a place where some significant petrochemical, machine-building and textile enterprises are situated, while Voronezh is a large centre of aircraft and electronic industries. Yaroslavl and Voronezh are considerable railway junctions and river ports (especially Yaroslavl). Nonetheless, even these notable cities are many times less important for banking networks than Moscow is (Figure 3). There are no locally registered banks of trans-regional significance. Financial service market is controlled mainly by Moscow corporations via their branches, but a large number of such branches strengthens commercial role of Yaroslavl and Voronezh. Although gaining almost equal scores, these cities are not direct economic rivals because of considerable spatial distance between them. Yaroslavl and Voronezh are connected via Moscow not only in administrative, but also in geographical and transportation sense. Within the Central FD Yaroslavl and Voronezh face some competition from Tula (the 19th place / 472,000 of population / 180 km from Moscow), while Smolensk (the 33rd place / 326,000 / 400 km) is far behind (Figure 3). It is notable that even these four cities together gain much less of aggregated ranking scores than Moscow gains alone. North West FD As in the previous case there is indisputable financial leader in the North West, too. In early GaWC studies St Petersburg (the 2nd place in national ranking by aggregated indices / 4,669,000 of inhabitants / 670 km from Moscow) is described as one of centres that have minimal evidence of world city formation process, alongside with Antwerp, Bologna, Dresden, Edinburgh, Glasgow, Leeds, Marseille, Turin, etc. (Table 7 in Beaverstock, Smith and Taylor 1999). Later it was calculated that St Petersburg takes the 32nd place in European ranking by banking connectivity: lower than neighbours in the table, like Bucharest, Vienna and Antwerp, but a bit higher than Bilbao, Rotterdam and Oslo (Table 1 in Taylor 2003). Probably this result is not very impressive for such a large city, but it was achieved after just 15 years of post-Soviet financial openness. St Petersburgs economy is based on diversified and technically advanced machine-building sector together with petrochemical enterprises, printing plants, software firms, food manufacturing and many other industries. It is gigantic transportation node, which includes Pulkovo international airport and the second largest seaport of Russia (after Novorossiysk). Besides, it is a city of rapidly growing service sector. St Petersburgs unofficial, but well-known brands like northern capital and cultural capital of Russia provide many additional advantages. As it was mentioned above, gap between Moscow and St Petersburg in Russian banking connectivity is not as large as in global financial networks (St Petersburgs values are 0.53 and 0.38 respectively, if Moscows value is taken as 1.00). So it can be supposed again that banking business in St Petersburg is more domestically, than internationally orientated. In any case, due to its mighty economic basis St Petersburg can develop both directions in parallel, thus moving up in various ranking tables. Other financial nodes of the North West FD are much less important, but the gap here is not so enormous as in the case of Moscow and Central FD. It can be seen most clearly if initial values of aggregated banking indices are recalculated from national scale into a regional one. As it was many times before, GaWCs manner of standardization is used for this new purpose. In the regional data set St Petersburgs value of aggregated index is taken as 1.00 instead of initial 0.5522 in the national ranking. Proportional growth of all individual values in the North West enables a kind of direct comparison between North West and Central FDs. Surely, analogous procedure was also made for all other Federal Districts. Figure 3 shows the results for five leading cities in every FD according to initial calculations in national scale, whereas Figure 4 depicts the corresponding situation in seven regional scales. Now turning back to the North West FD, it is necessary to name Kaliningrad (the 7th position in national ranking / 430,000 of inhabitants / 1,300 km from Moscow / 1,970 km from St Petersburg) as the second largest node of banking business in the territory. Traditionally it is known as a centre of shipbuilding, amber processing and some other industries. Besides, there are very important geographical features: Kaliningrad and area of its administration (Kaliningradskaya Oblast) form Russian exclave on the Baltic Sea shore. This Russias westernmost territory is surrounded by Lithuania and Poland (now the EU member states). Creation of Special Economic Zone, SEZ in the early 1990ies and its reorganization in 1996 1997 were attempts to exploit these geographical advantages. Although results of low customs policy are disputable, since then some important enterprises have been established, especially consumer electronics and motorcar manufacturing plants. New commercial prospects magnetize financial corporations too. There are no large banks registered in Kaliningrad (zero value of outdegree centrality in Table 2), but many of the leading Russian banks opened their branches there, so this relatively small city takes contrastingly high position in the national connectivity ranking (Table 1). The next highest value of aggregated banking index in the North West FD belongs to Archangelsk (the 23rd place in national ranking / 356,000 of inhabitants / 1,250 km from Moscow / 1,480 km from St Petersburg). Historically, local economy of this earliest Russian port is based on sea rout conveyances and exploitation of nearby wood resources. Now extraction of oil, gas and diamonds is another increasingly important factor for Arkhangelskaya Oblast and neighbouring territories. Archangelsk is followed by Murmansk (the 28th place / 337,000 / 2,160 km from Moscow / 1,490 km from St Petersburg): it is another significant port of the Arctic Seas, geographically close to Norway and Finland. Commercial role of Murmansk can get even greater, if proposed pipeline system will be constructed thus enabling exportation of Russian oil to North American markets. Vologda (the 39th place / 293,000 / 460 km from Moscow / 690 km from St Petersburg), which is an administrative center of highly industrialized area, takes the fifth place in the North West FD. Rather unexpectedly, Veliky Novgorod (the 48th place / 217,000 / 480 km from Moscow / 190 km from St Petersburg) is just the seventh. Novgorodskaya Oblast has a reputation of quite friendly territory for external investors, but just a few banks (among those included into this study) are presented there. Likely it is an example of shadow effect that is caused by huge concentration of service functions in nearby St Petersburg. South FD Due to its mild and sunny climate southern Russia magnetizes migration flows from other parts of the country and some neighbouring states. Many analysts suppose that demographical trends are favorable for economic future of the region. Nonetheless, there are considerable inner-regional differences. Undoubtedly, Rostov (the 6th position in national ranking / 1,070,000 of inhabitants / 1,100 km from Moscow) is the most important commercial centre in the South FD. This major port on the Don River is one of Russias main gateways to the Black Sea and Mediterranean regions. Also it is a traditional gateway between Russia and the Greater Caucasus. Rostov is known for its industrial sectors (especially, agricultural machinery and food manufacturing). This city is centre of huge metropolitan area, which consists of many minor towns. Rostov agglomeration (more than 2,100,000 of inhabitants) is the fifth largest in Russia, after Moscow, St Petersburg, Samara Togliatti and Nizhny Novgorod agglomerations (Lappo 1997, p.361). So there is a good basis for Rostovs role as a financial node. Rostov faces some competition from Krasnodar (the 13th place in national ranking / 645,000 of inhabitants / 1,370 km from Moscow / 270 km from Rostov). Although this city is considerably smaller than Rostov, it has advantages of another kind. Krasnodar is an administrative centre of Krasnodarsky Kray, which is the third most populated constitutional territory in Russia (just after Moscow and St Petersburg that have special constitutional statuses). Owing to fertile soils of the famous Kuban River valley, Krasnodarsky Kray is a very important agricultural area. Besides, some notable cites are also situated there, including Novorossiysk (the largest trading port of Russia) and Sochi (well-known resort place on the Black Sea shore). Certainly, the whole of Krasnodarsky Kray contributes into financial success of Krasnodar, where main advanced service functions are concentrated. Nevertheless, Rostov doesnt cease to be an obvious financial leader in the South, although not so enormously predominating as Moscow and St Petersburg in their FDs (Figure 4). Three other cities of the southern big five have very close values of aggregated index. Successively, these cities are as follows: Stavropol (the 25th place / 355,000 of inhabitants / 1,480 km from Moscow / 380 km from Rostov), Volgograd (the 27th place / 1,013,000 / 1,000 km / 460 km ) and Astrakhan (the 30th place / 506,000 / 1,470 km / 930 km) (Figure 4). It is a great surprise to see Volgograd at such low place. Being nearly equal to Rostov in population, it is almost two times less in aggregated index of banking influence. Although this phenomenon can be partly explained by newly gained administrative status of Rostov, higher population numbers of Rostovskaya Oblast and Volgograds relative remoteness from foreign markets, such situation needs further investigation. As for Astrakhan, it can become much more important in near future, since this city is very significant for Russias economic activity in the Caspian Sea region. Again, it is very important that Rostov, Krasnodar, Stavropol and even Volgograd (although not Astrakhan) are among few Russian cities with growing population6. Volga FD The most territories in the valleys of Kama and Volga are highly developed and urbanized ones. Among 13 Russian cities with more than 1,000,000 of population, five cities are situated in this FD. There are several financial and industrial competitors with quite comparable economic potentials. Chief administrative institutions of the Volga FD are located in Nizhny Novgorod (the 3rd position in national ranking / 1,311,000 of inhabitants / 420 km from Moscow). This city is often called the third capital of Russia (although at least two other cities, namely Yekaterinburg and Novosibirsk, can pretend to the same unofficial title). In this study Nizhny Novgorod is indeed the third largest in terms of connectivity, indegree centrality and aggregated index values (Tables 1, 2 and 3). Historical home of the biggest Russian fair, Nizhny Novgorod maintains its traditional mission in present-day commerce. The city and its suburbs are also acknowledged for their car manufacturing plants, chemical enterprises, shipyards, high-tech labs, etc. The Third Capital is a significant port on the confluence of the Volga and Oka rivers, in addition to its status of a very important railway junction. Besides, it is the eastern pillar of Moscow Nizhny Novgorod urbanized strip, a huge geographical formation that many researchers consider as mid-Russian megapolis (e.g. Lappo 1997, pp.371-373) with more than 15 million of population. Though being such a large and important city, Nizhny Novgorod doesnt dominate over its FD (Figure 4). The second largest node of banking activity in the region is Samara (the 8th place in the national ranking / 1,158,000 of inhabitants / 1,080 km from Moscow / 800 km from Nizhny Novgorod). It is a major centre of petrochemical, aircraft and food industries. Nearby city of Togliatti has a long-time reputation of Russian Detroit for its enormous motorcar factories. As it was mentioned earlier, Samara Togliatti agglomeration is the third biggest in the country just after Moscow and St Petersburg agglomerations. So, comparison between Nizhny Novgorod and Samara doesnt reveal an obvious winner. Each city has advantages of this or that kind. Nizhny Novgorod is larger in population numbers and values of many indices in this study, but even in this pair Samara is (e.g.) much more important hub of passenger airways traffic due to its Kurumoch international airport. Besides, there are two major banks with their headquarters in Samara (Solidarnost and Gazbank), while just one financial corporation of such size is registered in Nizhny Novgorod. Owing to branches of non-local banks Nizhny Novgorod stands higher in the aggregated ranking, but results are very close even in the regional scale: 1.00 for Nizhny Novgorod and 0.8435 for Samara evidently reflect degree of competition in the Volga valley. Perm (the 12th place / 1,000,000 of inhabitants / 1,500 km from Moscow / 1,080 km from Nizhny Novgorod) is the third largest financial center in the FD. This major centre of motor building enterprises and oil refineries is also a clear example of sub-regional banking node in the Kama valley, i.e. in the northeastern corner of this Federal District, nearby the Ural mountains. In the southern fringe of the Volga FD Saratov (the 20th place / 874,000 / 860 km / 660 km) is analogous sub-regional node of industry and finance. Nevertheless there is no direct competition between Perm and Saratov since these cities are rather remote from each other. Izhevsk (the 24th place / 632,000 / 1,220 km / 800 km) also should be mentioned here as a city with considerable financial role and developed banking linkages. On the other hand, there are two remarkable cases of quite different kind. Kazan (the 37th place / 1,105,000 of inhabitants / 830 km from Moscow / 410 km from Nizhny Novgorod) and Ufa (the 55th place / 1,042,000 / 1,350 km / 930 km) have much lower values of connectivity and banking influence than it could be expected. Economic possibilities of these cities are approximately equal to those of Perm (if not Samara), but their potentials are not implemented in the sphere of banking connectivity. Explanation is simple, however. Republic of Tatarstan (where Kazan is the capital city) and especially Republic of Bashkortostan (Ufa) are known for their strong protectionist policies. Moreover, headquarter of very large UralSib Bank, which has a lot of branches and subsidiaries in many regions, recently migrated from Ufa to Moscow. If protectionism is replaced by open market tendencies, these cities will get more important role in the banking ties, thus intensifying competition in the Volga valley and nearby areas. Urals FD Due to natural resources of the Ural Mountains this region takes outstanding position in national industry for many decades and even centuries already. Additionally, Middle and Southern Urals enjoy good transportation possibilities. Being situated on the eastern fringe of Europe, these territories are convenient gateways to rapidly growing markets of Central Asia, China and Pacific regions. On the other hand, Ural cities are located much closer to Moscow than Siberian cities are: certainly, it is a very important factor in Russian economy. Greatly industrialized and urbanized parts of the Urals (especially two dominating cities with more than 1,000,000 of inhabitants in each) play increasingly significant role in banking business, too. Yekaterinburg (the 5th place in the national ranking / 1,293,000 of inhabitants / 1,970 km from Moscow) is an administrative centre of this Federal District and its main financial node. Moreover, the city competes with Nizhny Novgorod and Novosibirsk for unofficial brand of the third capital, as it was mentioned above. Together with minor towns of its agglomeration Yekaterinburg produces vast amount of cathode cooper, various machinery, electronic equipment, cosmetics, etc. Thanks to its Koltsovo international airport Yekatertinburg has a reputation of the Urals air gateway. Also Yekaterinburg is recognized as a highly significant centre of scientific research. Financial position of Yekaterinburg is based on many local corporations, including six banks that are large enough to meet filtration principles of this study. Only Moscow and St Petersburg have higher numbers of banks registered there. As a result, Yekaterinburg holds the fourth position in national ranking by outdegree centralities (Table 2). Now it should be considered as even the third largest city, from the time when Ufa (No.3 in this 2003 ranking) lost its managing functions for the aforesaid UralSib Bank in 2005. Notably, evolution of banks in Yekaterinburg is a subject matter in special study by David Lane (at the University of Cambridge and Kingston Business School, UK) 7. Besides, Yekaterinburg plays a huge role in regional accounting and advertising business. Nevertheless, Chelyabinsk (the 9th place in the national aggregated ranking / 1,078,000 of inhabitants / 1,760 km from Moscow / 200 km from Yekaterinburg) can be seen as an alternative leader in the Urals. Earlier this city was in focus of another study by the author and his colleagues in line with GaWCs investigations (Nikitin, Romashov and Tolkunova 2002). For many decades Chelyabinsk has been known as a major industrial centre. The city produces ferrous metals (including high grade alloys and tubes for pipelines) in huge amounts, as well as various mechanical and electronic equipments. Gross industrial output of Chelyabinsk is approximately equal to that of Yekaterinburg. Nonetheless, transferring some industrial functions to minor towns, Chelyabinsk turns into a city with increasingly successful service economy. Being just moderately behind Yekaterinburg in the R&D sector, Chelyabinsk is also a city of some recognized universities and high-tech labs. Despite several differences, both cities are important nodes of transportation: Yekaterinburg is leading in passenger air traffic, but Chelyabinsk has certain advantages as significant railway junction nearby northern parts of Kazakhstan (which is a post-Soviet country with rapidly growing economy). In the sphere of finance Yekaterinburg and Chelyabinsk are also quite comparable. In seven regional ranking scales for all the FDs Chelyabinsk has the highest value of aggregated index among the second cities (0.8686; certainly, Yekaterinburg as the first city in its FD has 1.00) (Figure 4). So this pair of regional leaders in many ways resembles another one, namely Nizhny Novgorod / Samara in the Volga FD, but in the Urals shadow effect can be seen additionally, since Yekaterinburg and Chelyabinsk are located very close to each other. It is not easy to develop any alternative centre of finance nearby such major node as Yekaterinburg. Hardly there is any chance that Yekaterinburg will lose its leading position in forthcoming years and, maybe, decades. On the other hand, in Chelyabinsk industrial and financial basis of local economy is so powerful that the city effectively maintains and even strengthens its role in banking business in spite of these circumstances. Possibly, it can diminish now existing gap between itself and Yekaterinburg. Furthermore, this situation can be considered not only in terms of stiff competition, but also in quite different way. In the spheres where cooperation is possible, these two neighbouring cities can complement each other. Together Yekaterinburg and Chelyabinsk form a very bright double star of Russian financial sector. Tyumen (the 17th position in the national ranking / 511,000 of inhabitants / 2,240 km from Moscow / 340 km from Yekaterinburg) takes the third place in the Urals Federal District. This city is obviously smaller than two previous ones, but it has a potential advantage of another kind. The proposed territorial reform (reunification of Tyumenskaya Oblast and two northern areas, that are Khanty-Mansiysky avtonomny okrug, AO and Yamalo-Nenetsky AO) will turn Tyumen into administrative centre of the main oil- and gas producing province of Russia. Other cities in the Urals like Nizhny Tagil (the 58th place / 391,000 of inhabitants / 2,100 km from Moscow / 140 km from Yekaterinburg), Kurgan (the 63rd place / 346,000 / 2,030 km / 380 km), Surgut (the 64th place / 286,000 / 2,800 km / 900 km), etc. are much smaller in their financial service functions, but they are important because of their industrial activities. To a certain extent, this situation effectively accompanies financial leadership of the largest cities in the region. Siberian FD It is a vast area with matchless natural resources. From this point of view it is even more important than the Urals. However, harsh climate conditions and remoteness from Central Russia were always the obstacles to economic development of Siberia. Practically all the population is concentrated in southern parts of this FD where climate is much more favourable. Although density of population here is lower than in Central Russia and the Urals, there are dozens of significant cities in large urbanized strip along the Grand Trans-Siberian railway. Among all these cities Novosibirsk (the 4th place in the national aggregated ranking / 1,426,000 of inhabitants / 3,290 km from Moscow) is clearly the most important one. This relatively young metropolis was founded only in 1893 nearby bridges where the Trans-Siberian railway has crossed the Ob River, but after some decades of exceptionally rapid growth it became the third most populated city of Russia. So, from this point of view Novosibirsk is somewhat larger than other pretenders to the prestigious brand of the third capital, i.e. the above-mentioned Nizhny Novgorod and Yekaterinburg. Novosibirsk can be proud of its numerous machine-building enterprises, which produce equipment for agriculture, aviation, power stations, etc. But its logistic role is even more important: Novosibirsk controls junction between the Trans-Siberian railway and highly industrialized territories of the Southern Siberia, where Kuzbass is especially important for its coal and ferrous metals. Growing passenger traffic at Tolmachevo international airport is another advantage of Novosibirsk. Furthermore, Novosibirsk enjoys a reputation of outstanding scientific centre due to its universities and, especially, Akademgorodok (Small Academic City), which is a significant cluster of high-tech labs and other innovatory institutions. Certainly, newly gained administrative functions of the FDs centre are also notable. In some sectors Novosibirsk is the leading service and decision-making node for many nearby territories; in some other sectors it is even the regional capital of all Siberia. As for banking segment, it hardly belongs to the second category. In the sphere of regional finance Novosibirsk is more obvious leader than Yekaterinburg in the Urals FD, but less obvious than Rostov in the South, to say nothing of Moscow and St Petersburg in their Federal Districts (Figure 4). Such intermediate status can be illustrated by the following facts: on the one hand, there is only one major bank registered in Novosibirsk (Sibakadembank). On the other, this corporation established its branches in many remote regions, which is not a typical location strategy for banks registered in (e.g.) Samara, Yekaterinburg and Chelyabinsk. Sibakadembank demonstrates a Moscow-style manner of location decisions. Again, there are less ambitious, but more numerous financial corporations of such size based in Samara, Chelyabinsk and especially in Yekaterinburg. To a certain extent Novosibirsk is counterbalanced by Omsk (the 10th position in the national ranking / 1,134,000 of inhabitants / 2,600 km from Moscow / 700 km from Novosibirsk) in the western parts of Siberia. Omsk is a major centre of food, machine-building and aircraft industries. Since the 1960 - 1970ies Omsk is connected by forceful pipelines with enormous oil fields of the aforementioned Tyumanskaya Oblast and its northern neighbours. The series of oil booms turned Omsk into a location of the largest Siberian refineries. Besides, Omsk is the place where the central and northern lines of the Trans-Siberian railway meet each other. Like Chelyabinsk in the Urals, Omsk is very close to another part of Kazakhstan with its rapidly growing markets; this fact also can be seen as an economic advantage. Nevertheless, there is a disadvantage of another kind. Omsk practically has no agglomeration. Moreover, the whole of Omskaya Oblast is a small territory with a few minor towns. Enormous share of its population (55% of the gross population and almost 80% of the urban one) is concentrated in Omsk itself, which is an administrative centre of the Oblast and the only considerable city here. It should be mentioned that other cities of approximately the same size (Rostov, Nizhny Novgorod, Samara, Yekaterinburg and Chelyabinsk) are administrative centres of significant and highly populated territories (Rostovskaya Oblast, Nizhegorodskaya Oblast, etc.) with many medium-size industrial cities. Formally, Novosibirskaya Oblast is also small, but Novosibirsk is the outstanding service node for many remote territories. All these comparisons emphasize the factor that sets limits to financial influence of Omsk, although indirectly. However, mighty industrial basis and transportation facilities turn Omsk into the second largest financial node of Siberia. While Omsk is the western counterbalance to Novosibirsk, Krasnoyarsk (the 11th place in the national ranking / 912,000 of inhabitants / 4,070 km from Moscow / 780 km from Novosibirsk) is the eastern one. Krasnoyarsk is smaller than Omsk in population numbers, but the former city obviously has another advantage. Traditionally, it is administrative centre of Krasnoyarsky Kray, which is enormous territory stretching from the mountains of Southern Siberia to the Taimyr Peninsula and Arctic Ocean (2.3 million sq. km, 2.8 thousands km from the south to north). During the 1990ies Krasnoyarsk partly lost its control over the northern areas (Evenkiysky AO and Taimyrsky AO), but now the city regains its administrative role even more successfully than Tyumen in Urals FD does (the aforesaid case of Tyumenskaya Oblast and its northern neighbours is analogous). Consequently, Krasnoyarsk can restore some decision-making functions for many areas with rich natural resources and numerous enterprises (including the world largest centre of nickel, platinum and platinoids manufacturing in the Arctic town of Norilsk). Krasnoyarsk itself is important for its machine-building and woodworking plants, alongside with aluminum manufacturing. Besides, many analysts suppose that Yemelyanovo international airport at Krasnoyarsk can become very suitable hub for cross-polar air flights from North America to several parts of Asia. In the sphere of finance Krasnoyarsk is virtually equal to Omsk since aggregated index values are considered (Table 3; Figure 4). Additionaly, two cities have very close degrees of connectivity (Table 1), while Krasnoyarsk stands predictably higher than Omsk in the ranking by outdegree centralities (Table 2): Krasnoyarsky Kray is a convenient territory for financial expansion starting from its administrative centre. Irkutsk (the 14th place / 593,000 of inhabitants / 5,130 km from Moscow / 1,840 km from Novosibirsk), large industrial city nearby the famous Lake of Baikal, and Tomsk (the 18th place / 488,000 / 3,560 km / 270 km), the earliest academic centre of Siberia, are also among the Top 5 in this FD. Notably, these two cities also play significant role in the Russian space of financial flows. In the national-scaled ranking of aggregated indices Irkutsk stands higher than the other fourth largest cities in all the FDs, while Tomsk stands higher than the fifth largest ones (Figure 3). The biggest cities in the South Siberian strip attract many leading banks based in Moscow and St Petersburg. Far East FD Here the situation in financial service considerably differs from the analogous situation of Siberia, as its circumstances were depicted above. The easternmost parts of Russia are relatively close to dynamic markets of the Pacific Rim, especially North East China, South Korea and Japan. Theoretically, such neighbourhood can be quite encouraging, but until now opportunities are not converted into an adequate economic success. Moreover, there is unfavourably low degree of advanced service linkages between this FD and the central regions of Russia. Not a single Far Eastern city is presented in the national Top 20 rankings by connectivity and aggregated index values (Table 1, Table 3). Only in the Table 2 (outdegree centralities) Khabarovsk, which is the chief administrative centre in this FD, can be seen at the 17th position. Figure 3 also depicts relatively lower results for the Far East in comparison with other Federal Districts. It is appropriate to start this regional survey with comments not on Khabarovsk, but on another city, namely Vladivostok (the 22nd place in the national aggregated ranking / 592,000 of inhabitants / 9,320 km from Moscow / 760 km from Khabarovsk). Far East is the only case where position of the leading financial centre in a region and a site of FDs administrative institutions are not combined in one city: these functions are allocated between Vladivostok and Khabarovsk respectively. Vladivostok and its suburbs form a mighty node of seaports and railway terminals. The bay of Golden Horn in Vladivostok as well as nearby ports of the agglomeration are less than 1,000 km away from the ports of Maizuru in Japan and Busan in South Korea. This fact is quite noteworthy since Vladivostok and Trans-Siberian railway are increasingly important logistic alternatives to long sea routes between Japan (or Korea) and Europe across the Indian Ocean. Besides, Vladivostok is a place of considerable shipyards and machine-building enterprises. Its financial role is based mainly on presence of some Moscow-located banks, but many others have no branches in this remote city: as a result Vladivostok takes the 24th place in the national connectivity ranking, just behind Stavropol, Astrakhan and Tyumen. As for aggregated indices, Vladivostok, again, is the 22nd. Comparison between the Far East FD and other Federal Districts shows that this regional leader could be only the 4th largest in the Urals, the 5th in the Centre and just the 7th in Siberia. Another financial node of the Far East is Khabarovsk (the 32nd place / 583,000 of inhabitants / 8,560 km from Moscow): as the capital of this FD it has both administrative and commercial advantages. Khabarovsk is situated at the place where the Trans-Siberian railway crosses the Amur River, which is also important for transportation. Due to its geographical position Khabarovsk is the centre of gravity for the most populated southern parts of the Far East FD. Besides, pipelines stretching from the Isle of Sakhalin to the Amur valley enabled to build significant oil refineries in Khabarovsk. Reconstruction of Chita Khabarovsk highway (a major national project that is in progress now) will intensify linkage between Khabarovsk and cities of Siberia. It is also should be mentioned that Khabarovsk stands almost on the border between Russia and China (province of Heilongjiang); the city is less than 1,000 km away from Harbin and 1,800 km from Beijing, which are not very long distances for Eastern Asia. Khabarovsk-located DalkomBank demonstrates rather ambitious strategy and establishes its branches in many parts of the Far East FD. However, banking linkages between Khabarovsk and other FDs through corporative networks are even fewer developed than analogous linkages of Vladivostok. Blagoveschensk (the 50th place / 219,000 of inhabitants / 7,860 km from Moscow / 680 km from Khabarovsk) is obviously less important economically than two regional leaders, but it is also a considerable transportation node situated at the confluence of the Amur and Zeya Rivers. It is the chief commercial centre for the area of considerable hydro resources and power stations (including that on the Bureya River; this recently built power station is one of the most impressive construction projects in post-Soviet Russia). Like Khabarovsk, Blagoveschensk also exploits opportunities of cross-border trade with China. Chinese city of Heihe on the opposite bank of the Amur grew outstandingly since local markets became open in the late 1980ies. In its turn, closeness of Heihe is quite important factor for the further financial progress of Blagoveschensk. Two other financial nodes of the Far East are Magadan (the 53rd place / 121,000 of inhabitants / 10,150 km from Moscow / 4,200 km from Khabarovsk) and Yakutsk (the 70th place / 210,000 / 8,470 km / 2,520 km). Both cities are administrative centres of very remote northern territories with rich natural resources like coal, tin, gold and diamonds. Neverthless, Magadan and Yakutsk dont play notable roles in national banking business. E.g., aggregated index value for Yakutsk is just 0.0564. Being theoretically removed from the Far East to other FDs, it could be downgraded from its initial 5th position to the 10th place in the North West, the 15th in the Volga FD and the 20th in the Centre. Certainly, these results highlight again the fact that major cities of the Far East are less involved into nationally wide corporative networks than major cities in other regions of Russia. Finally, after all these comments on many individual cities, some generalizations are also possible. This stage of the study can reveal several verifying facts and additional characteristics. Table 4 depicts contribution of each Federal District to gross national values, both in population numbers and in aggregated banking indices, which were calculated here. The main results of comparisons between two spheres are given in the right column of the table. Certainly, in absolute sums of banking indices the Centre is predictably on the top (its share is 27.45%), whereas the Far East takes the lowest place (5.12%). Since correlations between banking indices and population numbers are considered, the Urals and North West turn into the most financially filled regions (correlations are 1.33 and 1.26). The Far East, Siberian and Central FDs are adequately involved into banking business (correlation values are relatively close to 1.00). Although the Far East doesnt cease to be a financial fringe, at least it is developed proportionally to its demographical resources. The Volga FD (0.85) and especially the South FD (0.72) are less popular with the Russian banking corporations. Such situation can be explained by the aforesaid isolationist policies in some administrative territories in the former FD and by significant share of non-urban population in the later one. In Table 5 some of customary descriptive statistics for the Federal Districts are given. It is remarkable, for example, that the Far East has the lowest value of standard deviation. In this region the gap between its financial leaders and peripheral cities is not so enormous as in other FDs (especially in the Centre and North West where standard deviation values are much higher). In terms of statistical skewness Far East also shows a kind of egalitarian tendencies (the rate of skewness is minimal), while in the Urals it is almost three times higher: certainly, such asymmetry emphasizes again an important role of Yekaterinburg, Chelyabinsk and Tyumen in regional (and national) finance. Nevertheless, in the North West and especially in the Central FD skewness values are even greater. Besides, these regions have by far the highest means and especially values of the abovementioned sigma, standard deviation. So, Moscow and St Petersburg visibly influence almost every way of measurement in their FDs (both in Table 4 and Table 5), while other regional leaders have analogous influence only in several cases. Such contrast is also important for investigation of the entire banking sector and its geography. Besides, it is important for some inferences in the present study. CONCLUSIONThis paper hardly needs too detailed summarization. The most of major cities were mentioned and their economic roles were commented in the previous sections of the article. The most of calculated data are given in the figures and tables. However, at least one kind of a systematized scheme can be seen through this mosaic of many local economies. Various measurements (individual values, descriptive statistics in regional variations, Lorenz curves, etc.) quite clearly highlight the leading positions of Moscow and St Petersburg. Basically, these data correspond to previous studies, which examine roles of Moscow and St Petersburg in global economy. Despite some terminological disputes, Moscow can be treated now as one of the world cities. Recently this theoretical idea was empirically proved in quite evident way. According to GaWC, Moscows proportional connectivity is valued as 0.42, while London, being on the global top, has the maximal value of 1.00. As for St Petersburg, which is also known as the northern capital of Russia, it doesnt belong to the global financial elite, but is getting closer to such circles every year. Thus St Petersburg is often considered as an emerging world city. What can be said about other Russian centres of finance? Certainly, the third largest city (whether it is Nizhny Novgorod by aggregated banking index or Novosibirsk by population numbers) is far behind the second one. On the other hand, the gap between Moscow and St Petersburg is even greater; nevertheless, St Petersburg now follows successfully many tendencies that earlier were seen only in Moscow. Such comparison can be extrapolated to St Petersburg / Nizhny Novgorod, St Petersburg / Novosibirsk and some other pairs. Besides Moscow and St Petersburg, there are several considerable cities in the country. Surely, they have absolutely no chances to join the first dozens of the GaWCs global ranking even in the long-term prospect, but it is possible to see one day some of these cities in, say, the third or even the second hundred. Of course it would mean a notable role in cross-border financial service, too. It can be assumed that Russia (if the size of national economy is taken into account) would be presented in a future long list not only by its two metropolises, but by two, three or four other centres as well. It is not easy to name the exact cities now. There are ten or so major centres; the most of them have 1.0 1.5 million of population. Financial, industrial and geographical characteristics of all these cities were examined in the present study, region by region. Despite the great diversity of many individual cases, the one evident thing is an approximate equality of economic powers. Almost everywhere, in many pairs, triangles and other configurations there are nearly equal competitors with their advantages and disadvantages counterbalanced. Following the audit of these pretenders and their chances in the present study, some suppositions can be made, but in rather conditional and preliminary way. In this theoretical hierarchy Nizhny Novgorod, Novosibirsk, Yekaterinburg and probably Rostov stand on the upper level. They are followed by Samara, Chelyabinsk and (likely) Omsk and Krasnoyarsk; remarkably, the difference between these two quartets is quite moderate. Besides, Perm, Kaliningrad and Vladivostok should be mentioned following the previous set of eight cities. That is how the situation looks currently, at least. Once again, this listing of cities is very changeable. Active extensions, reductions or inner rearrangements are quite possible. Russias entering to the WTO (GATS) will also influence the situation soon. Many facts and tendencies can be revealed by future investigations in line with variety of GaWCs methodologies. Regular monitoring will enable to see individual trajectories, regional constellations and aggregated national results in this large and significant economy. ACKNOWLEDGEMENTSThe author is grateful to his colleagues in Chelyabinsk, Russia, for useful comments on the earlier draft of this paper. It is a pleasure to mention Eugenia Konysheva (Chelyabinsk State Pedagogical University), Elena Khalina (Chelyabinsk Institute of Trade and Economy) and Alexander Romashov (Chelyabinsk State Pedagogical University / Catholic University of America, Washington DC) personally. REFERENCESAlderson A.S. and Beckfield J. (2004) Power and Position in the World City System, American Journal of Sociology, 109, p. 811-51. Beaverstock J.V., Smith R.G. and Taylor P.J. (1999) A Roster of World Cities, Cities, 16 (6), 445-458. Bratko A.G. (2001) The Central Bank in Russian Banking System, Moscow: Spark (in Russian). Bukato V.I., Golovin Yu.V. and Lvov Yu.I. (2001) Banks and Banking Operations in Russia, Moscow: Financy i Statistika (in Russian). Derudder B., Taylor P.J., Witlox F. and Catalano G. (2003) Hierarchical Tendencies and Regional Patterns in the World City Network: a Global Urban Analysis of 234 Cities, Regional Studies, 37, pp. 875-86. Friedman J. (1986) The World City Hypothesis, Development and Change, 17, 69-83. Gritsai O. (1996) Postindustrial Shifts in Moscow: the Global City Concept and Economic Restructuring, Izvestija RAN, ser. geograficheskaja, 5, p.90-97 (in Russian). Gritsai O. (1997a) Moscow under Globalization and Transition: Paths of Economic Restructuring, Urban Geography, 18, 2, 155-165. Gritsai O. (1997b) Economic Transformation and Local Urban Restructuring in Moscow, Russian Regional Research Group, Working Paper Series, Number 11. The University of Birmingham. Gritsai O. (1997c) Business Services and Restructuring of Urban Space in Moscow, GeoJournal, August, .42/ 4, 365-376. Gritsai O. (1997d) Economic Restructuring of Moscow in the International Context, GeoJournal, August, 42/4, 341-347. Gritsai O. (2003) Business Services in Transitional Economies. The Case of Russia, GaWC Research Bulletin 104. Forthcoming in: "Brokers of Capital and Knowledge in Asia: Changing Power Relations". Routledge, London. Gritsai O. (2004) Global Business Services in Moscow: Patterns of Involvement, Urban Studies, 41 (10), pp.2001 2024. Gritsai O. (2005) Foreign and Local Professionals in the Moscow Offices of Global Business Service Companies, GaWC Research Bulletin 162. Gubanov S. (1999) The Moscow Industrial Policy Model, Problems of Economic Transition, 42, 4: 5-28. Ioffe G. and Nefedova T. (1998) Environs of Russian Cities: The Case Study of Moscow, Europe-Asia Studies, 50, 8:1325-1356. King A.D. (1991) Global Cities: Post-Imperialism and the Internationalization of London, London: Routledge. Kolosov V. (1997) Political Polarization at the National and Intra-Urban Levels: the Role of Moscow in Russian Politics and the Socio-Political Cleavages within the City, GeoJournal, 42: 4, 385-401. Kolosov V., Vendina O. and OLoughlin J. (2002) Moscow as an Emergent World City: International Links, Business Developments and Enterprenearial City, Eurasian geography and economics, 43 (3), 170-196. Lane D. (2001) The Evolution of Post-Communist Banks in Russia, Cambridge: University of Cambridge, Faculty of Social and Political Sciences. Lane D. (ed.) (2002a) Russian Banking: Evolution, Problem and Prospects, Cheltenham: Edward Elgar Publishing. Lane D. (2002b) Russias Peculiar post-Soviet Banks, Financial Regulator, vol.7, no.1, pp.43 48. Lappo G.M. (1997) Geography of Cities, Moscow: Vlados (in Russian). Matovnikov M. (2000) Activity of Russian Banking System under Macroeconomic Instability, Moscow: IEPP (in Russian). Nikitin L., Romashov A. and Tolkunova I. (2002) A Changing Image of Steel Giant: Chelyabinsk as an Example of Transformations in Post-soviet Russia, GaWC Research Bulletin 90. OLoughlin J. and Kolosov V. (2002) Moscow: Post-Soviet Developments and Challenges, Eurasian geography and economics, 43 (3), 161-169. Rossi E.C. and Taylor P.J. (2004a) Banking Networks Across Brazilian Cities: Interlocking Cities Within and Beyond Brazil, GaWC Research Bulletin 147. Rossi E.C. and Taylor P.J. (2004b) Brazilian Cities Within Domestic and Global Banking Circles, GaWC Research Bulletin 148. Sassen S. (1991) The Global City: New York, London, Tokyo, Princeton, NJ: Princeton University Press. Sassen S. (1994) Cities in a World Economy, Thousand Oaks, CA: Pine Forge Press. Taylor P.J. (2001) Specification of the World City Network, Geographical Analysis, 33 (2), 181-194. Taylor P.J. (2003) European Cities in the World City Network, in H. van Dijk (ed.) The European Metropolis 1920 2000, Rotterdam: Erasmus Universiteit Rotterdam. Taylor P.J. (2004a) World City Network: a Global Urban Analysis, London: Routledge. Taylor P.J. (2004b) Parallel Paths to Understanding Global Inter-city Relations, GaWC Research Bulletin 143. Forthcoming in American Journal of Sociology, 110. Taylor P.J. (2004c) Leading World Cities: Empirical Evaluations of Urban Nodes in Multiple Networks, GaWC Research Bulletin146. Taylor P.J. and Catalano G . (2002). World City Network Formation in a Space of Flows in Stadt und Region: Dynamik von Lebenswelten, Tagungsbericht und wissenschaftliche Abhandlungen, 53. Deutscher Geographentag Leipzig, 29. September bis 5. Oktober 2001. Edited by A.Mayr, M.Meurer and J.Vogt. Leipzig: Deutsche Gesellschaft fuer Geographie, 2002, p. 68 76. Taylor P.J., Catalano G. and Walker D.R.F. (2002a) Measurement of the World City Network, Urban Studies, 39, 2367 76. Taylor P.J., Catalano G. and Walker D.R.F. (2002b) Exploratory Analysis of the World City Network, Urban Studies, 39, 2377 94. Taylor P.J., Catalano G. and Walker D.R.F. (2004) Multiple Globalizations: Regional, Hierarchical and Sector Articulations of Global Business Services through World Cities, The Service Industries Journal, 24 (3), pp. 63-81. Taylor P.J., Walker D.R.F. and Beaverstock J.V. (2002). Firms and their Global Service Networks. In Sassen S. (ed) Global Networks, Linked Cities, New York - London: Routledge, 93-115. Wasserman S. and Faust K. (1994) Social Network Analysis: Methods and Applications, Cambridge: Cambridge University Press. NOTES* Leonid V. Nikitin, Department of History, Chelyabinsk State Pedagogical University, Russia, Lnd2001nikitin@mail.ru , 1. Certainly, simple ranking by connectivity values is just a small part of possible network analysis in line with GaWCs methodology. 2. Again, calculation of outdegree and indegree centralities is just a fraction of toolkit that is described and employed by Alderson and Beckfield. 3.So the data are valued rather in Alderson and Beckfields, than in GaWCs sense of the word. 4.Here and henceforth population numbers are given in accordance with the General Census of 2002. 5.In this and the following cases highway distances are given. 6.According to the General Censuses of 1989 and 2002. 7.University of Cambridge, Faculty of Social and Political Sciences. Annual Reports 2001/2002 and 2002/2003. http://www.sps.cam.ac.uk/annualreports/annual_reports Table 1: Top 20 cities ranked by nodal size and network connectivity values
1. Shown as whole numbers. Table 2:Top 20 cities ranked by outdegree and indegree centrality values
Table 3:Top 20 cities ranked by aggregated indices of banking influence
Table 4:Generalized data on aggregated indices and population numbers for the Russian Federation and its Federal Districts (FDs)
1. Only the cities those are included into this study. Table 5:Descriptive statistics for aggregated banking indices in their regional distribution
Figure 1:Lorenz Curves: Top 20 cities and their successively accumulating contribution to summated banking connectivity 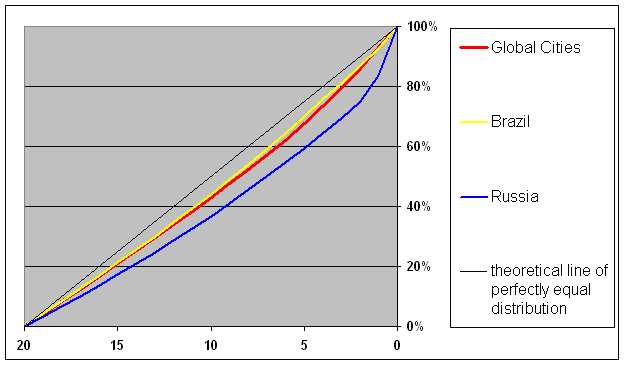
Figure 2: Comparison between the results produced by GaWCs and Alderson & Beckfields methods Figure 3: Five leading centres of banking activity in every Federal District (national scale) Figure 4: Five leading centres of banking activity in every Federal District (regional scales) Edited and posted on the web on 17th June 2005 |
||||||||||||||||||||||||||||||||||||||||||||||||||||||||||||||||||||||||||||||||||||||||||||||||||||||||||||||||||||||||||||||||||||||||||||||||||||||||||||||||||||||||||||||||||||||||||||||||||||||||||||||||||||||||||||||||||||||||||||||||||||||||||||||||||||||||||||||||||||||||||||||||||||||||||||||||||||||||||||||||||||||||||||||||||||||||||||||||||||||||||||||||||||||||||||||||||||||||||||||||||||||||||||||||||||||||||||||||||||||||||||||||||||||||||||||||||||||||||||||||||||||||||||||||||||||||||||||||||||||||||||||||||||||||||||||||||||||||||||||||||||||||||||||||||||||||||||||||||||||||||||||||||||||||||||||||||||||||||||||||||||||||||||||||||||||||||||||||||||||||||||||||||