GaWC Research Bulletin 147 |
|
|
|
This Research Bulletin has been published in Cities, 22 (5), (2005), 381-393. doi:10.1016/j.cities.2005.07.002 Please refer to the published version when quoting the paper.
INTRODUCTIONThe purpose of this paper is to investigate how banks in Brazil link national cities to each other and to world cities in the wider global economy. The banking sector constitutes a critical advanced producer service wherein individual banks provide capital and financial instruments to Brazilian-located firms, both domestic and foreign. This financial servicing takes place within cities and through city networks. Thus detailed geographical research on the office networks of major banks in Brazil enables us to provide a particular insight into how Brazilian cities are faring under conditions of contemporary globalization. Of course, Brazilian cities with ‘international’ links, integrated city networks, and a developed banking system all predate contemporary globalization in Brazil. As with other countries, Brazil’s cities evolved with its economy through several urban-economic stages. IPEA (et al. 2001, v.2, p. 346) have identified three such historical periods before the pressures of contemporary globalization. First, an Atlantic slave territorial formation from the sixteenth century to the national independence when cities and hinterlands were complementary in their functions in a trans-Atlantic colonial framework; after independence the rise of latifumdium power led to cities assuming endogenous financial functions, produced a network of (largely) seaport cities facilitating, in Frank’s (1969, 6-7) famous terminology, ‘metropolis-satellite relations’ linking local and national economies to the ‘metropolitan centre in Europe or the United States’ in a single ‘global, national, and local structure’. Second, from the 1870s through the 1940s a national agricultural-market territorial formation led to a clear separation of cities from hinterlands continuing the city’s role in underdevelopment. Third, a national industry-urban territorial formation from the 1950s through the 1970s created an industrialization process and began to establish an endogenous accumulation logic, thus giving rise to the integration of the national urban network (IPEA et al., 2001, v2, 346). Thus before the onset of globalization in the last decades of the twentieth century, Brazilian cities were firmly embedded in a city-based industrial economy. Interpretation of the latter formation and how it relates the contemporary era is contested. In his well-known analysis, Milton Santos (1993) focuses upon communications. Thus it follows that integration of a national market based upon metropolises had to await state government’s investment in communication infrastructure after 1945. However, with the economic collapse of the 1980s, it is major firms, both domestic and foreign, that take control of the recently constituted national market creating a highly vertical structure centred on Sao Paulo. Thus in Santos’s interpretation, through a combination of market failure and new information technology, the state has lost its role as articulator of national planning. This appears to have continued into the 1990s: according to Fernandes and Negreiros (2001, 425, 428) Brazilian urban development in the 1990s was acutely influenced by the reduction of import barriers. The effect on production chains reduced industrial activity and drove less privileged regions into competition for foreign investors at both city and regional levels. In terms of location, public and private investment was then concentrated in the Southeast (64.3%), followed by Northeast (17.6%), South (9.4%), North (7.5%), and Centre-West (1.2%). On the other hand, IPEA (et al.2001, v.2, 346) offer an alternative understanding of this process that they term an international financial phase starting in the 1970s through to the 1990s. Here the exhaustion of the financial model of the state has resulted in dispersion rather than concentration. IPEA points to the birth of new dynamic centres such as Manaus, Brasilia-Goiania and Fortaleza and a simultaneous reduction in the growth of Sao Paulo and Rio de Janeiro. Data from 1990 and 1996 Census has revealed that the urban growth has changed from concentration to dispersion, in comparison with the 80s – the growth rate decreased in the metropolises (the Northeast excluded) and rose in medium-sized cities. Brasilia, Curitiba, Goiania, Belem, Fortaleza, Campinas and Vitoria all posted a population growth rate above the average (IPEA et al. 2001). These diverse interpretations draw upon different aspects of recent urban change and therefore they may not be as contradictory as they first appear. Sassen (2000a and b) has always emphasized that the economic geography effects of globalization are a subtle mix of concentration and decentralization processes. Certainly there is one thing all parties will agree on: the myriad processes behind globalization have had major impacts upon Brazilian cities and how they relate to each other and to the global economy. In this paper we do not directly test the veracity of the two diverse interpretations. Rather we take a step back and try to provide some initial measurements of inter-city relations within and beyond Brazil. We offer a cross-sectional analysis of the connectivities of Brazilian cities at the beginning of the twenty-first century. Thus we are addressing questions relating to the first theme that Fernandes (2001) identifies – ‘global cities’ – from the seven topics he recognises in his review of the Brazilian urban studies literature. However, within this theme, research has employed national data: for instance, the last IPEA study (2001) asserts that Sao Paulo and Rio de Janeiro are ‘global metropolises’ but does not identify or measure the global connections of these two leading Brazilian cities. It is precisely this omission that we seek to rectify in this paper.The argument is presented in 4 substantive sections. First, we present the interlocking model relating firms to cities upon which our analyses are based. Second, we describe the data collection for operationalizing this model. This involves tracing the office networks of leading banks in Brazil. Third, we present banking connectivity of Brazilian cities within Brazil. This is compared to existing descriptions of the ‘Brazilian urban system’. Fourth, we look at the connectivity of Brazilian cities with major world cities beyond Brazil. In a conclusion we consider briefly how these analyses inform debates on contemporary Brazilian cities. INTERLOCKING CITY NETWORKSThe methodology upon which this research is based has been described in detail as a ‘world city network’ in Taylor (2001) and applied in practice in Taylor (2004). Here we provide a summary, first describing the interlocking network model that is the framework, and then showing how the model can be used to derive measures of connectivity between cites. Most network models have two basic components, the nodal level and the net level, Usually the nodes are the agents who produce and reproduce the network, for instance a set of individuals who form a gang wherein gang members are agent-nodes and their inter-relations define the gang as a network. Such a model is inappropriate for studying economic networks of cities, however, because it would reify the cities. In other words, we do not want to model cities as agents creating economic networks, rather cities are locales housing the agents who do the network formation. In this argument the world city network is the result of firms carrying out their business. In recent years such business has become increasingly transnational. Following Sassen (2001a), our model focuses upon advanced producer service firms as a cutting edge sector in contemporary economic globalization. In order to service their increasingly transnational clients, such service firms have had to follow them across the world and provide a service wherever clients operate. In order to maintain brand integrity, this has meant that advanced producer service firms have had to set up offices in cities worldwide. It is this global location policy producing worldwide office networks that has generated a world city network. It is these ‘global service firms’ who ‘interlock’ cities in the course of their everyday operations: the myriad of intra-firm flows of information, knowledge, instruction, strategy, plans, ideas, personnel, etc. between offices. Thus it is firms who are the agents of world city network formation in their interlocking’ of cities. This is modelled as an interlocking network with three levels: as well as the net (world economy) and nodal levels (the cities) there is the subnodal level (the firms). Notice that this adding of a third level is not an optional addition, the whole network is predicated on the behaviour of agents at this new level. This model of the world city network can be formally stated as a matrix defined by a universe of m firms and n cities. The cells of the matrix are defined as vij which is the service value of city i for firm j. This service value indicates the quantity and quality of activity in a given firm’s office in a given city, its contribution to the operation of the overall office network of the firm. Given this service values matrix, interlock connectivity between cities is defined as where Ca is the interlock connectivity of city a. In Taylor (2004) inter-lock connectivities are computed for a universe of 315 cities across the world and 100 global service firms. However this model does not have to be used to measure global connectivities for advanced producer firms in general. The universe defining the matrix can be reduced in terms of both cities and firms. This is what we do here. As already made clear the network making activity we are interested in is banking. This made up just one, albeit the largest, of six sectors that constituted the firms used to generate the world city network model. In this paper we focus only upon banking/finance firms. Also we focus upon Brazilian cities and selected major world cities. The model for computing interlock connectivity does not, of course, change but to emphasize the differences between this research and previous studies we can define where Ba is the banking connectivity of city a, and ßij defines banking activity values. It is these connectivities that are presented and discussed for Brazilian and world cities in the remainder of this paper. DATA COLLECTION - CITIES AND BANKSThe specification of the interlocking network model directs the data collection: we need information on the activities of selected banks in selected cities. Thus there are two stages. First, we have to define the universe of banks and cities for our study. Second, we have to assess the importance of banks’ offices across the cities. We drew on previous studies to select our cities. For the global level we used the analysis of global network connectivity reported in Taylor (2004) and selected those cities ranked in the top 25. These are listed by geographical regions in Table 1 and it can be seen that there is reasonably broad coverage of the three major globalization arenas. These are world cities that we will be using to evaluate Brazilian cities’ global connections. For selecting Brazilian cities we have examined the location distribution of the top 500 firms in Brazil. These are, of course, the leading customers of the banks we will be studying. Table 2 shows that as the Brazilian economy contracted in the late 1990s and early 2000s, sales of these top 500 companies managed to increase. The outcome in economic concentration has been dramatic: for the latest figures we have, sales of these companies constitute three-quarters of the country’s GNP. There were 868 firms included in the seven-year period covered by Table 2, and these were headquartered in 167 Brazilian cities. We compared these cities with a recent IPEA study (2001) that found 49 city-regions made up of 461 individual cities. 114 of our 167 cities belong to 40 IPEA Brazilian city-regions, while the other 53 cities were isolated and scattered around the country. Sales analysis of the IPEA city-regions and cities showed that 30 of them (listed in Table 2), 22 city-regions and 8 detached cities, concentrated more than 96% of the top 500 firms’ sales. These are the Brazilian cities selected for this study. Because Sao Paulo occurs in both the global and Brazilian lists, the total cities used in the analyses is 54. Selection of banks was based on three sources: (1) the Brazilian business magazine EXAME Melhores e Maiores (2003), which published the results of the top 50 banks operating in Brazil in 2002, ranked by total assets; (2) the web site of the Brazilian Central Bank (3 May 2004), whose databank informed (i) the rank of the banks of the Financial Brazilian System according to their balance in December 2003, plus (ii) the group each bank belongs to and (iii) the bank branch cities; and (3) the banks’ web pages on the Internet, where the distribution of the banks office networks in Brazil were confirmed, and offices in the selected world cities were found. Starting with the top 50 banks, we eliminated any bank that did not have a presence in at least four of the 54 cities in the study. 19 did not thus qualify so our final selection was 31 banks.To produce the 54 x 31 banking activity matrix, banking activity values (ßij in equation (2)) had to be estimated. The method adopted for this exercise was based upon that used for construction of the global data set (Taylor et al. 2002). In this case, cities were evaluated firm by firm through coding offices as follows: 4 for world headquarters, 3 for headquarters in Brazil, 2 for a branch, and 1 for an atm (self service); with absence recorded as zero. 1674 such values were created to produce the final cities x banks activity matrix ready for analysis. BANKING CONNECTIVITY WITHIN BRAZILResults on connectivity analyses of Brazilian cities are reported in three parts: a description and discussion of the connectivity scores; how these scores relate to the market data in Table 3; and the network pattern of links between cities. Connectivity Strata of Brazilian CitiesThe connectivities derived for Brazilian cities from the banking activities matrix are shown in the first two columns of Table 4. The raw totals from equation (2) have been converted into proportions of the highest scoring city (Sao Paulo). This facilitates comparisons and is the common way to report connectivities (Taylor, 2004) – it is used for reporting all connectivity values in this paper. The first results in Table 4 show a very dominate Sao Paulo with Rio de Janeiro firmly in second place. These can be interpreted as the two top strata of Brazilian cities in terms of banking interlock connectivity (BIC). Another six strata are identified in Table 4 using gaps in ranked connectivities as boundaries. Thus Curitiba, Belo Horizonte, Porto Alegre, Brasilia, and Salvador make up the third strata of city connectivities. In the final three columns of Table 4, connectivities are based upon just banking links between Brazilian cities. This defines the domestic connectivity of the cities and we can notice immediately that, compared to the overall connectivity (which includes global links), the dominance of Sao Paulo is eroded. This is what we would expect given that Sao Paulo’s role as the financial gateway into the Brazilian economy is removed from the analysis. Nevertheless Sao Paulo remains firmly on its own in a first strata. In the second strata, although Rio de Janeiro is much closer to the top city, it is now joined by Belo Horizonte to create a two-city second strata. Curitiba, which is ranked third for overall connectivity is surpassed by Belo Horizonte in the domestic connectivity. The third strata keeps the same content minus Belo Horizonte but the ordering changes with Brasilia and Salvador rising above Porto Alegre for domestic connectivity. Other cities that rise in ranking for domestic connectivity compared to overall connectivity are Fortaleza, Caxias do Sul, Vitoria, Belem and Montes Claros. This analysis suggests that these are cities that play a more important role in the national city network than they do for external banking relations. Connectivities and MarketsThe differences between the two connectivities discussed above are, quite small. A simple rank correlation produces a coefficient of 0.98. However, such simple rank analyses can help us explore the relationships between connectivities and the sales reported in Table 3. Sales define the total market scope of the top 500 companies. The table orders city-regions/detached cities by total sales and we have added a second ranking using cities only. For instance, whereas Porto Alegre is ranked behind Belo Horizonte as a city-region, it overtakes the latter when both are treated as individual cities. Thus we have four rankings to compare: overall connectivity, domestic connectivity, city-region market, and city market. The correlations are shown in Table 5.Three features stand out in Table 5. First, overall connectivity has higher market correlations than domestic connectivity. This suggests the former is a better discriminator of market size. Second, city-region/detached city has higher correlations with connectivity than individual cities. This suggests the former are the prime units for assessing connectivity. Third, and most important, is the fact that the correlations do not indicate very strong relationships. In other words, despite these statistically significant correlations, there are some major discrepancies between connectivity and market. In Table 6 we have chosen the variables with the largest correlation (overall connectivity and city-region/detached cities) and listed the largest discrepancies in the rankings. Thus we identify five cities that are much more connected than their market size would suggest and a contrary set of five that appear to be seriously under-connected in relation to their markets. The cities with low connectivities are easier to explain: they tend to be located in the more remote regions or near over served city regions (Sao Jose dos Campos is near Sao Paulo). The over-connected cities attract banks relating to their particular roles: for instance Santos as the leading Brazilian port. Brazil’s Banking Network of CitiesThe connectivity of each Brazilian city is made up of the sum of its banking links with all other cities (equation (2)). We can, therefore, divide the connectivity into its constituent links to show the geography of the network. From Table 4 we know that Sao Paulo dominates this network and this is reflected in the fact that every other citiy’s largest link is with Sao Paulo. However, there is complexity below this top level and this can be shown through identification of the second highest links of cities. These are presented in Table 7 where we see that five cities share the second links. These are the cities of strata II and III in Table 4 except for Salvador. Two features of this table are immediately noteworthy. First, the fact that it is Brasilia that has most second links. Second, it is the strata II cities from Table 4 (national BIC), Rio de Janeiro and Belo Horizonte, that have the strongest links with other highest ranked cities. As well as having Sao Paulo’s first (Rio de Janeiro) and second (Belo Horizonte) links, these two cities have the second links of all strata II and III cities. Thus, although Brasilia has most second links, these are with cities from lower strata. In fact it is Curitiba that has the most impressive list of second links after Rio de Janeiro and Belo Horizonte, focusing as it does on the new dynamic centers the IPEA (2001) study highlighted. To obtain a more complete picture of the Brazilian banking city network, however, we need to go beyond first and second links. In all, our analysis produces estimates of 435 links between the 30 Brazilian cities. It is not possible to show all of these diagrammatically so we have selected the larger links for display. Again, to facilitate comparison, we convert the connectivity links into ratios of the largest link (Sao Paulo-Rio de Janeiro). We then consider two levels of linkage: the 30 links that are above 0.5 (Figure 1), and the 44 links that are between 0.4 and 0.5 (Figure 2). In the resulting two cartograms, cities are represented in their approximate relative geographical positions.All major links in Figure 1 (defined as above 0.75) are with Sao Paulo. In addition this city has far more links (12) than any other city. These basic findings confirm our previous analyses and lend support to the arguments of Santos (1993) and Schieffer (1999) that Sao Paulo is the dominant urban centre, thus maintaining a position begun during the period of national industry-urban territorial formation. Simultaneously, Sao Paulo garners most links on Figure 2. The latter figure includes all 30 cities and it can be seen that six are not connected to the network at the 0.4 threshold. With this additional set of links we can see first, that there is a Brazil-wide network created by the banks, and this network is focused, not just upon Sao Paulo, but an inland swathe of cities from Belo Horizonte through Sao Paulo to Curitiba is emerging as a broad economic core. Note that coastal Rio de Janeiro (as well as coastal Porto Alegre and Salvador, and interior Brasilia) is outside this core. This city’s links on Figure 4 are remarkably low for the country’s second city: there are only 4 links, which is less than seven other cities. The network presence of Rio de Janeiro increases when the intensity of the links is between 0.33 and 0.4, nevertheless relatively minor cities such as Uberlandia, Caxias do Sul, Brasilia, Santos and Blumenau have a better performance. Thus Figure 2 lends support to IPEA’s (2001) argument about the rise of dynamic medium-sized cities. These results also confirm Lessa’s (2000) diagnosis about the situation of Rio de Janeiro: although the city is still the country’s number two city, it has yet to consolidate a new role within contemporary globalization. BANKING CONNECTIVITY BEYOND BRAZILThis subject is approached in three steps. First, we report the global banking connectivies of Brazilian cities and compare them to the previously considered national linkages. Second, we consider the banking linkages between Brazilian cities and the world cities in our data. A map of the major transnational linkages is presented and discussed. Third, we turn our attention to the world cities themselves and compare their roles in Brazilian banking to their global banking connectivity derived from previous studies (Taylor 2004). The Transnational Connectivities of Brazilan Cities Through BankingThe first three columns of Table 8 present the connectivities for Brazilian cities computed by using just world cities outside Brazil. These transnational connectivities are presented the same format as Table 4 to facilitate comparison with the previous city lists for overall and national connectivities. The main result is that viewing Brazilian cities globally greatly enhances the dominance of Sao Paulo. All other cities’ connectivities are smaller relative to Sao Paulo; for instance, in the new list only Rio de Janeiro scores above 0.5 whereas in the overall list there were 15 such cities, and for national connectivities all but six cities scored more than half. In addition we can note that Rio de Janeiro, while falling in connectivity relative to Sao Paulo, does draw away from other Brazilian cities: in other words the importance of Rio de Janeiro among Brazilian cities is also enhanced at the global scale. The ranking of cities for transnational linkages is broadly in line with the rankings in Table 4 but there are important variations. In the new rankings Porto Alegre and Curitiba clearly move above Belo Horizonte. This is reflected in the strata where the former two are allocated their own strata. The other new division is between Campinas and Fortaleza which are adjacent ranks in Table 4 but the former joins Belo Horizonte in strata IV while latter falls to the general strata V in Table 8. More generally, direct comparisons with the national connectivities are made in the final column of Table 8. Only Sao Paulo has transnational connectivity of over one half of its national connectivity. As might be expected, of the remainder, Rio de Janeiro and Porto Alegre have the next highest ratios. However, beyond this top end of the list, there appears to be little relationship between these ratios and levels of city connectivity. This suggests the particular linkage to world cities is relatively concentrated among Brazilian cities. Banking Connections Between Brazilian Cities and World CitiesFigure 3 is devised in the same manner as Figures 1 and 2 to facilitate comparison. In this case the highest link is between Sao Paulo and New York and all other links are made proportionate to this one. The same thresholds are used to show links but in this case they are all presented on one cartogram. This leads to just one major link (Sao Paulo-Tokyo) although two links fall just below the threshold (Sao Paulo-London and Sao Paulo-Buenos Aires). Clearly Sao Paulo dominates the diagram as would expect, the new clear finding is that New York plays a similar dominant role globally: Sao Paulo has eleven transnational links, New York has ten and the next highest is Buenos Aires with just four.Beyond the Sao Paulo/New York dominance there are four other noteworthy features of the diagram. First, as just mentioned, the relative importance of Buenos Aires: it clearly rivals more important international financial centres in its relations with banks in Brazil. Second, despite Sao Paulo-Tokyo, the three leading Pacific Asian financial centres have relatively few links between them. And, thirdly, this contrasts with western European cities. Although individually they are not rivals to New York, collectively they are clearly important. Fourth, the latter is especially the case if the comparison is made to the USA: no other US city joins New York on the cartogram. World Cities in Brazilian BankingThe above features of Figure 3 are brought together as Brazilian banking connectivities in Table 9. Again connectivities are reported as proportions of the highest to help comparison. In this case New York can be seen to be quite dominant, well ahead of London, Tokyo, Buenos Aires, the latter not so surprising given Figure 3. The key feature of this list is the relative low rankings of Pacific Asian cities beyond Tokyo and US cities beyond New York. The second column in Table 9 is taken from previous work (see Taylor 2004) and shows the 24 cities in terms of their overall banking connectivity. This shows high connectivities for Pacific Asian cities as well as for the leading US cities. By regressing Brazilian connectivities against these global connectivity scores, the residuals from the least squares line can be computed to show which cities are more connected through banks in Brazil than expected for their global banking importance, and which are less so connected. The results are given in the fourth column of Table 9 in which residuals are standardised. As will have been surmised, the city with the greatest increase in connectivity to Brazilian cities relative to its worldwide role is Buenos Aires. This is in keeping with studies that show important regional tendencies in the configuration of the world city network (Taylor 2004). Buenos Aires is the only non-Brazilian South American city in this study but notice also the high positive residuals for Mexico City and Miami. New York, Madrid and Frankfurt also have high positive residuals reflecting the origins of important foreign banks in Brazil. In contrast the bottom six cities, those with high negative residuals showing a much smaller role in Brazilian banking compared to their global prowess, includes the three leading US cities after New York (Los Angeles with the highest negative residual, San Francisco and Chicago) plus two other Pacific Rim cities (Hong Kong and Sydney) and Mumbai. Notice two further findings: with the exception of Tokyo, all Pacific Rim cities have negative residuals whereas, with the exception of Zurich, all European cities have positive residuals. Both findings lend additional evidence for the Europe-Asia differentiation first identified in Figure 3. Finally it is worth reviewing the stark contrast between US cities in this analysis. New York dominance is clear and appears to eclipse other US cities. This has been previously identified as New York’s ‘shadow effect’ over other US cities (Beaverstock et al. 2000; Taylor and Lang 2004). The lack of Brazilian connections to Los Angeles, San Francisco and Chicago, each important global banking centres, is quite remarkable: in US banking terms Brazil is almost a ‘New York only territory’. The exception is, of course, Miami, often dubbed the ‘capital’ of Latin America: its special transnational regional role appears to have inoculated it against New York dominance in Brazil. CONCLUSIONThis has been a particularly dense empirical paper but the wide range of findings do provide a unique and consistent set of insights into how Brazilian cities are faring under conditions of contemporary globalization. Clearly, and no shock, Sao Paulo is dominant and its dominance increases when just transnational connections are computed. However, this domination has never before been measured and illustrated so precisely. Similarly, it is no surprise that Rio de Janeiro is always in second position. However, again, the precision of our measurements enabled us to show that its number two slot is far stronger globally than domestically. Beyond these two leading Brazilan cities, our measurement tools have provided completely new findings: Porto Alegre and Curitiba’s transnational strengths in contrast to Belo Horizonte’s domestic strength is just one of many examples of new comparative evaluations of Brazilian cities. The transnational connectivity strengths of Campinas, Recife and Ribeirao Preto alongside Brasilia and Salvador are specifically noteworthy. On the other side of the connections, the fact that New York is clearly more important to banks in Brazil than its ‘global city’ rival, London, is not surprising, but the position of Buenos Aires in these results is much less expected. And what does this all mean for the conflicting interpretations of contemporary Brazilian urban trends that we reported in the introduction? As we indicated, there is no reason for divergence and concentration of economic processes should not develop at the same time. This may well be the norm with globalization. Thus we find clear evidence for Sao Paulo’s dominance, particularly for global connections, while at the same time we find plenty of evidence that medium-sized cities are relatively well connected. This confluence of outcomes is summed up well in the paper’s three figures, especially Figure 3 which is perhaps the paper’s most important result, that show both concentration and decentralization by banks in their uses of Brazilian cities. ACKNOWLEDGEMENTSEliana Consoni Rossi was supported by CNPq, a Brazilian governmental institution that supports Scientific and Technological development. We acknowledge Prof. Elton Fernandes (Production Engineering, COPPE, UFRJ, Brazil) for his help with the preliminary dataset. NOTES* Production Engineering, COPPE, Federal University of Rio de Janeiro consoni@pep.ufrj.br and Department of Geography, Loughborough University gyecr@lboro.ac.uk ** Department of Geography, Loughborough University and Metropolitan Institute at Virginia Tech P.J.Taylor@lboro.ac.uk REFERENCESBeaverstock, J V, Smith, R G and Taylor, P J (2000) World city network: a new metageography? Annals, Association of American Geographers 90, 123-34. Fernandes, E (2001) Urban Brazil: past and future. Geoforum 32, v-ix. Fernandes, A C and Negreiros, R (2001) Economic developmentism and change within the Brazilian urban system, Geoforum, 32, 415-435. Frank, A G (1969) Latin America: Underdevelopment or Revolution. Monthly review Press, New York. IPEA, IBGE and UNICAMP (2001) Caracterização e tendências da rede urbana do Brasil, IPEA, Brasilia, V. 1-6. Lessa, C (2000) O Rio de todos os Brasis. Record, Rio de Janeiro.Santos, M (1993) A Urbanização Brasileira. Hucitec, Sao Paulo. Sassen, S (2001a) The Global City. Princeton, NJ: Princeton University Press.Sassen, S (2001b) Cities in a World Economy. Thousand Oaks, CA: Pine Forge. Schiefer, S.R. (1999) Sao Paulo como polo dominante do Mercado unificado nacional. In C Deák and S R Schiefer (Eds), O processo de urbanização no Brasil. Edusp, Sao Paulo, pp. 73-110. Taylor, P J (2001) Specification of the world city network. Geographical Analysis 33, 181-94 Taylor, P J (2004) World City Network – A Global Urban Analysis, Routledge, London. Taylor P J and Lang R E (2004) US Cities in the World City Network, Brookings Institution, Washington DC. Table 1: Top 25 world cities defined by global network connectivity
Figures in brackets are actual rankings Table 2: Rates of the Annual Sales of the top 500 firms in Brazil in Brazilian GNP (1966-2002)
Sources: Brazil. Ministerio da Fazenda. Banco Central do Brasil. Economic and Financial Information Databank. Time Series. Economic activity. Real sectors. National accounts. GDP. 4386. http://www4.bcb.gov.br/pec/series/ingl/default.asp (28 April 2004) and EXAME Melhores a Maiores. http://portalexame.abril.com.br/ (Oct-Nov 2003) Table 3: Main Brazilian city-regions and detached cities which headquarted the top 500 firms in Brazil from 1996 to 2002
Sources: IPEA (2001) and EXAME Melhores a Maiores. http://portalexame.abril.com.br/ (Oct-Nov 2003) Table 4: Banking interlock connectivities (BIC) for Brazilian cities
Table 5: Rank correlations between measures of city connectivities and city markets
Table 6: Over-supplied and under-supplied banking cities
Table 7: Second largest banking links of Brazilian cities
Table 8: Global banking connectivity of Brazilian cities
Table 9: World cities in Brazilian banking
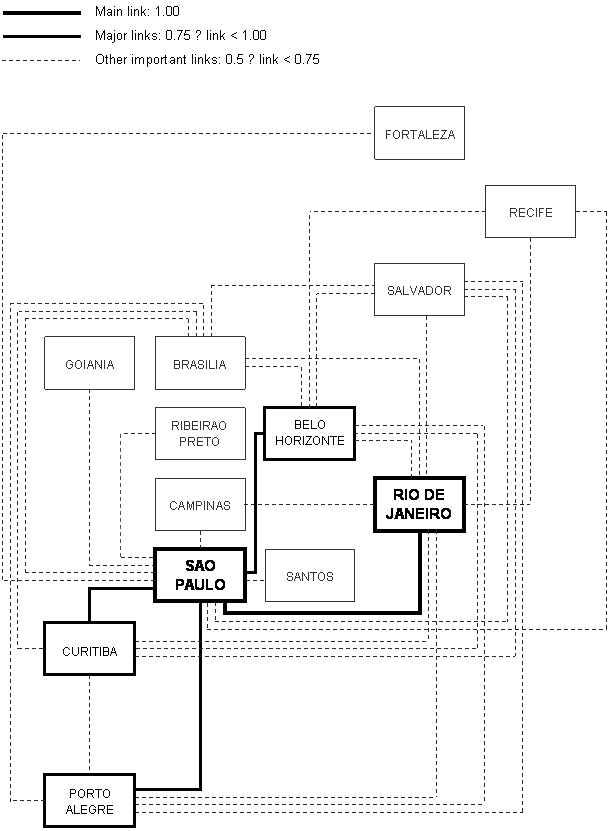
Figure 1: Brazilian Inter-City Links based upon Banking Networks: I Main and Major Links
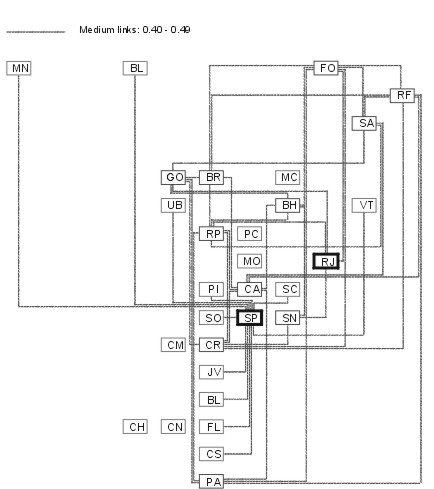
Figure 2: Brazilian Inter-City Links based upon Banking Networks: II Medium Links
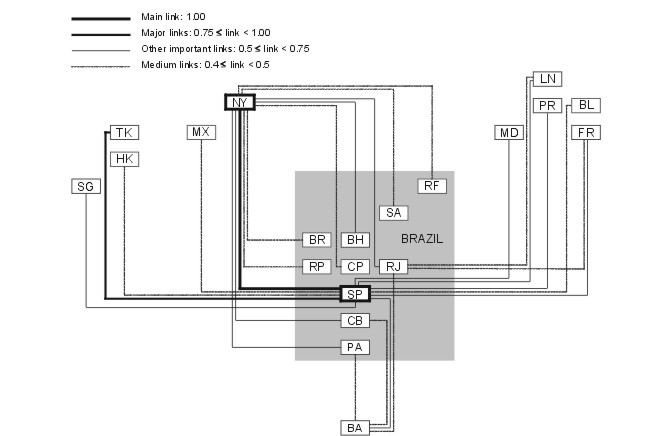
Cities with Main Links: SP Sao Paulo, RJ Rio de Janeiro, BH Belo Horizonte, BR Brasilia, CA Campinas, CR Curitiba, FO Fortaleza, GO Goiania, PA Porto Alegre, RF Recife, RP Ribeirao Preto, SA Salvador, SN Santos. Cities with Medium Links: BL Belem, BN Blumenau, CS Caxias do Sul, FL Florianopolis, JV Joinville, MN Manaus, PI Piracicaba, SC Sao Jose dos Campos, SO Sorocaba, UB Uberlandia, VT Vitoria. Cities with only Minor Links: CH Chapeco, CM Campo Mourao, CN Concordia, MC Montes Claros, MO Mogi Guacu, PC Pocos de Caldas. Figure 3: Transnational Brazilian Intercity Links based upon Banking Networks
Transnational cities Codes: BA Buenos Aires, BL Brussels, FR Frankfurt, HK Hong Kong, LN London, MD Madrid, MX Mexico City, NY New York, PR Paris, SG Singapore, TK Tokyo. For Brazil city codes, see Figure 2. Edited and posted on the web on 26th August 2004 Note: This Research Bulletin has been published in Cities, 22 (5), (2005), 381-393 |
|||||||||||||||||||||||||||||||||||||||||||||||||||||||||||||||||||||||||||||||||||||||||||||||||||||||||||||||||||||||||||||||||||||||||||||||||||||||||||||||||||||||||||||||||||||||||||||||||||||||||||||||||||||||||||||||||||||||||||||||||||||||||||||||||||||||||||||||||||||||||||||||||||||||||||||||||||||||||||||||||||||||||||||||||||||||||||||||||||||||||||||||||||||||||||||||||||||||||||||||||||||||||||||||||||||||||||||||||||||||||||||||||||||||||||||||||||||||||||||||||||||||||||||||||||||||||||||||||||||||||||||||||||||||||||||||||||||||||||||||||||||||||||||||||||||||||||||||||||||||||||||||||||||||||||||||||||||||||||||||||||||||||||||||||||||||||||||||||||||||||||||||||||||||||||||||||||||||||||||||||||||||||||||||||||||||||||||||||||||||||||||||||||||||||||||||||||||||||||||||||||||||||||||||||||||||||||||||||||||||||||||||||||||||||||||||||||||||||||||||||||||||||||||||||||||||||||||||||||||||||||||||||||||||||||||||||||||||||||||||||||||||||||||||||||||||||||||||||||||||