GaWC Research Bulletin 113 |
|
|
|
This Research Bulletin has been published in Global Networks, 5 (1), (2005), 71-91. doi:10.1111/j.1471-0374.2005.00108.x Please refer to the published version when quoting the paper.
1. BEYOND CONFIGURATIONS: THE WORLD CITY-SYSTEM AS GLOBAL NETWORKAlthough the world city-system has frequently been described as a hallmark example of a global network (e.g. Castells, 1996, p. 415), it has rarely been analysed just like any other, more conventional network (Taylor, 2004, p. 114). Hence, despite the fact that the notion of a world city network has been widely invoked, it has only seldom been analysed in a standard network-analytical framework (for notable exceptions, see Shin and Timberlake (2000); Smith and Timberlake (2001, 2002); Alderson and Beckfield (2004)). The main reason for this dearth of network analyses is off course to be found in the paucity of data detailing inter-city flows at the global level (Short et al, 1996; Cox, 1996), but recent attempts to rectify this data deficiency problem (Beaverstock et al, 1999; Taylor et al., 2002) have equally been characterised by the absence of full-fledged network analyses. In Derudder et al. (2003), for instance, a detailed taxonomy of the world city network was constructed by applying a fuzzy clustering algorithm to a database detailing the global strategies of 100 advanced producer services firms across 234 cities. In this study, the use of network-analytical tools was limited to the use of simple overall connectivity measures to unveil the hierarchical element in the world city clusters. As a consequence, this taxonomy reflects a series of similarity-groupings rather than revealing, for instance, cohesive sub-networks within the overarching world city network. Previous exploratory researches have thus been built upon measures that infer network patters rather than upon a genuine network analysis, and it is therefore the prime purpose of this paper to illustrate how a conventional network-analytical framework can be used to analyse inter-city relations within contemporary globalization. This paper is divided in three sections. In a first section, we outline the rationale behind the construction of matrices that systematically assert relations between pairs of world cities. This is achieved by extending Sassens (2000) basic conception of world city formation to account for world city network formation through its specification as the complex amalgam of multifarious office networks of corporate service firms. The end-result of this formal specification is a symmetrical inter-city matrix of connections between all pairs of world cities. This matrix can then be subjected to various forms of analysis available to simpler types of network, which is the subject matter of the second section. The network-analytical framework we present in this second section is based upon the conjectural use of two standard network measures. First, we use this high level of measurement to define global network connectivities for cities. Second, we dichotomise these measures creating simple binary information on inter-city links (i.e. link or no link) for individual clique analyses. This results in the identification of cohesive sub-networks at several levels of connectivity. In the third section, we apply this framework to our dataset on two separate levels of connectivity, which allows us to discuss some of the complex and multifarious tendencies in world city network. 2. SPECIFICATION OF THE WORLD CITY NETWORKThe call for a network-analytical approach is copious in the world/global cities literature, since the most seminal contributions to this body of research (Friedmann, 1986, Sassen, 2000; 2001) deem inter-city relations crucial in linking urban development to the restructuring of the world economy. In this context reference to conceptual frameworks such as a global network of cities (King, 1990, p. 12) has become commonplace, albeit without any accompanying formal specification and scrutiny in a network-analytical framework. This conceptual advance without rigorous analytical and empirical support is clearly illustrated in Castells (1996) hugely influential Rise of The Network Society. Castells much-debated theory of space, which deals with the complexity of the interaction between technology, society, and space (p. 377), has provided a theoretical grounding for understanding inter-city relations as constituting global networks. The bottom line in Castells theory of space is that society is increasingly dominated by a networked spatial logic, which is the material organisation of time-sharing practices that work through flows (p. 412). This spatial logic has three layers: (i) the infrastructure networks that make the contemporary Network Society possible (e.g. through electronic impulses), (ii) the social networks of places which constitute the nodes and hubs through which Network Society is routinely organized, and (iii) the distinctive elite social networks that form the spatial organisation of the cosmopolitan rich in their work, play and movement. Castells identifies the world city network as a crucial component of the middle layer, dubbing it the most direct illustration of a social network of hubs and nodes (p. 415). However, despite its theoretical sophistication, Castells treatment of world cities is quite conventional. For instance, he identifies Sassens (2001) triad (London, New York, Tokyo) as top of a global urban hierarchy (p. 379). This mismatch between conceptual sophistication and weak empirical support has long been a characteristic of world city research in general (Short et al., 1996), and this is, in large part, due to the fact that relevant social statistics on relations between world cities are not readily available. Our first task is therefore to understand why this is so before we can begin to rectify the situation. 2.a. A Transnational Interlocking NetworkThe world city network is an unusual social network for two distinctive reasons, one practical and the other conceptual. First, the large geographical scale of this network involves a specification that moves beyond the extent of individual states. In social science research, however, most data on social networks has been collected through small-scale cumulative scientific activity (e.g. Faust et al., 2000). To get an evidential handle on big issues, researchers normally rely on the statistics that are available, that is to say, already collected. But such collection is carried out usually by a state agency for the particular needs of government policy rather than for social science research. The result is that such data that are available have an attributional bias (measurements of administrative areas rather than between administrative areas) and are limited to national territories. Where official statistics extend beyond a states boundaries they will still use countries as the basic units (e.g. trade data). Thus there is no official agency collecting data on, say, the myriad flows between London and New York which is, arguably, Main Street, World Economy (Derudder et al 2003). This inter-city relation, and relations between other world cities, are essentially transnational in nature and therefore do not feature in conventional statistical sources (Taylor, 1997). This is the basic reason why the information we need for describing the world city network is not readily available, and it is thus no surprise that social network analysis in urban studies has focused on small-scale networks (e.g. Lai, 2001). The second element for designating the world city network an unusual network is that cities the nodes in this network are not in themselves the crucial actors of the network. In other social networks, individuals in roles or nation-states through governments can reasonably be interpreted as the agents in the production and reproduction of their networks. Cities, however, are different. Although they do have decision-making administrations, and competition between cities is part of world city network formation (Kresl, 1995), this constitutes just a small component of the overall process. In order to tackle both problems, the Globalization and World Cities Group and Network (http://www.lboro.ac.uk/gawc) has developed a methodology for studying world city network formation, which has been largely based on Saskia Sassen's work on place and production in the global economy. According to Sassen (1995, 2000, 2001), it is advanced producer firms (e.g. firms providing legal, advertising and consulting services) who are the key actors in world cityi formation. Thus in GaWC researches (see Taylor 2004), these same actors are identified in world city network formation. Through their worldwide activities they create an inter-locking network. Unlike most social networks, interlocking networks have three levels instead of two: as well as the network level (world economy) and the nodal level (world cities), there is also a sub-nodal level (global service firms). It is the latter that is the level at which world city network formation occurs through the location decisions of the firms. Through their attempts to provide a seamless service to their clients across the world, these financial and business service firms have created global networks of offices in cities around the world. Each office network represents a firms global strategy for dispensing its services, and is an outcome of location decision-making at the scale of the world-economy. It is the myriad of flows between offices information, data, instructions, ideas, plans, people that constitutes the world city network as we conceive it in this paper. Firms are therefore the network inter-lockers, linking cities together in the day-to-day practice of their business. 2.b. Formal Conceptual SpecificationOnce identified as an interlocking network, the world city network can be formally specified. This is provided in detail in Taylor (2001), here we provide the basic elements of that specification as an introduction to subsequent data collection before embarking on the social network analyses. The importance of this specification lies precisely in its relation to data and subsequent measurement. There are no available large-scale data on actual flows, electronic or otherwise, between the offices of private service firms. As well as confidentiality, the sheer scale of collecting such origin-destination information means that such data are likely never going to be available. Thus there can be no direct measures of flows between offices, and thus cities, to define the interlocking network. In these circumstances, we have adopted the standard scientific response of generating indirect measures through defining a model of the process being measured. Thus inferred measures of flows are derived from data that is readily available by employing plausible assumptions within the context of the model, the interlocking network of world cities. Specification of the world city network starts with a universe of m advanced producer service firms in n world cities. The importance of the office of a firm j in city i is measured through its service value vij, which can be arrayed as a service value matrix Vij. Assuming there is no actual information on inter-office flows for firms across cities, the basic relational element rab,j for each pair of cities is derived from matrix Vij as:
which defines the relation between cities a and b in terms of firm j. The conjecture behind conceiving this elemental interlock link as a surrogate for actual flows of inter-firm information and knowledge between cities is that the more important the office, the more connections there will be with other offices in a firm's network. This approach is reasonable when the following assumptions are made. First, offices generate more flows within a firms network than to other firms in their sector. This is inherently plausible in a context where protecting global brand image through providing seamless service is the norm. Second, the more important the office, the more flows are generated and these have a multiplicative effect on inter-city relations. The first part of this assumption is obviously very plausible again. The second part reflects (i) the fact that larger offices with more practitioners have the capacity to create more potential dyads, and (ii) the hierarchical nature of office networks where larger offices have special functions like control and provision of specialised knowledge. Each world city has n-1 links rab,j, and the aggregate city interlock link across all firms is then produced from:
In order to take full advantage of all the dyadic information available from equation (2), we need to consider all relations to ascertain the systemic patterning of nodes and linkages. This requires the creation of a square (n x n) relational matrix, E, using the city inter-lock link rab for all city pairs. This elemental relational matrix is more interpretable if transformed into a proportionate relational matrix P where linkages are given as proportions of the maximum possible linkage. This maximum is:
where hj is the highest service value provided by firm j across all cities. Matrix P is then the array of all n x n proportional city interlinks:
Finally, to complete specification of these relational matrices it is necessary to define the matrix diagonal as the "self-relation" of each city, which is not asserted in equations 2 and 4. For dimensional equivalence these self-relations are defined as:
for matrix E and
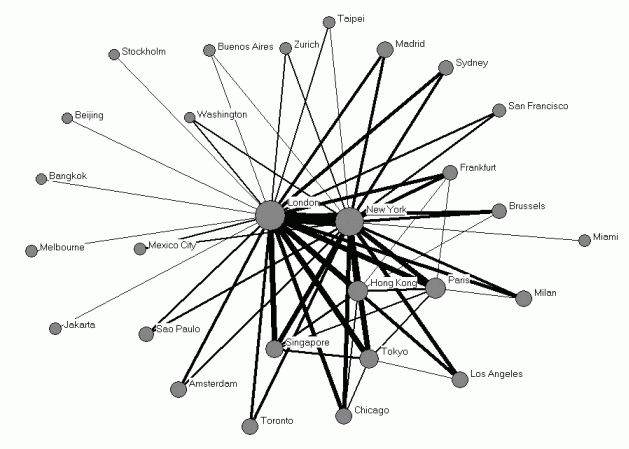
for matrix P. 2.c. Empirical SpecificationBased on this formal specification, the data requirements for measuring this network are straightforward: a matrix of n firms with information about their offices across m cities, where the information in each cell has to describe the importance of city y to firm xs global service provision. This is described in detail elsewhere (Taylor et al., 2002) and only the basic features are described here. A global service firm was defined as having offices in 15 or more different cities with at least one city in each of northern America, western Europe and Pacific Asia featuring in its office network. 100 firms were thus identified in six sectors: 18 in accountancy, 15 in advertising, 23 in banking/finance, 11 in insurance, 16 in law, and 17 in management consultancy. Selecting cities was much more arbitrary and was based upon previous experience in researching global office networks. Capital cities of all but the smallest states were included plus many other important cities in larger states. Data was collected on 315 cities, but for heuristic reasons the analysis below will be restricted to consideration of the 50 most connected cities. Data collection focused on the size of offices (e.g. number of practitioners) and their extra-locational functions (e.g. regional headquarters). The nature of the information collected was specific to each firm and these differences had to be standardized to provide comparable service values. Measures of vij ranging from 0 to 5 were constructed for city offices of all firms as follows. The city housing a firms headquarters was scored 5, a city with no office of that firm was scored 0. A city with an ordinary or typical office of the firm was scored 2. With something missing (e.g. no partners in a law office), the score reduced to one. Particularly large offices were scored 3 and those with important extra-territorial functions (e.g. regional offices) scored 4. The starting point of the empirical model was thus a 315 x 100 matrix Vij where vij ranges from 0 to 5, and using the conceptual specification outlined in the previous section and only considering the 50 most connected nodes (for a specification, see section 3.a.), this was converted into a 50 x 50 proportionate relational matrix P where linkages are given as proportions of the maximum possible linkage. Table 1 provides an excerpt of the proportionate relational matrix P, which can be conceived as the persistent relationships that arise from aggregated effects of the interactions between the firms through the seamless service they wish to provide. 3. NETWORK ANALYSIS OF THE WORLD CITY NETWORKOne of the major benefits of this precise specification of the world city network is that it provides measures of inter-city relations that can be analysed just like any other more conventional network. More specifically, the derived measures will be used in our network analyses in two ways. First, we use them in the first section below to define global network connectivities for cities. Second, we dichotomise these measures creating simple 0/1 information on inter-city links for different degrees of connection to carry out individual clique analyses. Obviously much information is lost in this procedure but since we dichotomise at different positions, some of the information is retained by varying the cutting point between definition of link and no link. 3.a. Global Network ConnectivityThe most basic measure of a city is its connectivity in relation to all other cities in the matrix. Taking one city at a time, aggregating all the inter-lock links produces the global network connectivity (GNC) of a city:
The limiting case is a city that shares no firms with any other city so that all of its elemental links are 0 and it has zero connectivity. In practice with our large data set, these global network connectivities can be quite large numbers. To make them manageable in our use below, we express city connectivities as proportions of the largest computed connectivity in the data (i.e. London) thus creating a scale from 0 to 1. Table 2 presents the GNCs for the 50 most connected cities. The most salient conclusion is that London and New York are considerably more connected than any other city in this global urban network. At first glance this may not be thought to be surprising, but in this case our singling out of these two cities is based on empirical evidence that is both comprehensive (i.e. the location strategies of 100 advanced producer firms) and rigorous (i.e. based on a theoretical specification). However, for those cognisant with the literature, there is actually a surprise: Tokyo is only ranked 5thin this list. This contradicts the commonly held view (drawn from the work of Sassen (2001)) of a world city network dominated by a trilogy of global cities, with Tokyo joining London and New York at the top. From our evidence Tokyo appears at a level below London and New York alongside Hong Kong and Paris. 3.b. Cliques as Cohesive SubgroupsCohesive subgroups have always represented an important construct for social scientists that study individuals and organizations in a networked context (Frank, 1995), and the world city network is no exception to this rule. Probably the most popular tool to assess cohesive subgroup is a clique analysis, where a clique is defined as a maximal set of actors in which every actor is connected to every other actor. In social network analysis, a clique is thus defined as a set of nodes in which each is connected to all the others (Scott, 1991, p. 117). It is normally depicted on a diagram as a complete graph, a set of nodes all connected to each other. In Figure 1, for instance, the network includes two complete graphs, A and B, each of which constitutes a clique, and, in addition, B as a four-point complete graph that automatically encompasses two three-point complete graphs. Applying a clique analysis to the world city network thus allows disentangling the overall connectivity in tangible relational patterns, since cliques of world cities are cohesively interrelated to each other, and, overall, weakly to outsiders. As a consequence, it is possible that nodes with a comparable level of global network connectivity can be found in different cliques on the basis of having distinct relational patterns. Global relational patterns will vary from city to city, and this spatial variation can be captured by the particular nature of its cliquishness. Note that the graph depiction in Figure 1 assumes that all links are based upon binary data: nodes are either connected or not connected. However, the links in the inter-city matrix derived above are variable and define a valued graph. Thus in order to carry out a clique analysis this valued graph has to be converted into a binary graph: the values of links have to be dichotomized so that only values above a selected threshold constitute connections (Scott, 1991, p. 113). Thus, applying a clique analysis to our database implies slicing the data at different thresholds, which allows employing this technique in an exploratory manner to analyse the complexity of the world city network using different slices through the proportionate relational matrix P. We begin by focusing on one initial slice where pabis 0.4, which we will term the linkage threshold. That is to say, only proportional interlock links between cities above 0.4 are included in the analysis as inter-city links. These linkages are shown in Figure 2. At linkage threshold 0.40, a total of 17 cliques are formed from just 19 cities (Table 3). Not surprisingly given their very high general network connectivities, London and New York form the core of every clique: 11 of the cliques are constituted by just one other city having links to these two leading cities (see Figure 2). The larger networks are more interesting and show that Frankfurt and Brussels have levels of linkage with the most connected world cities that would not be expected for their general network connectivity levels in Table 2. Similarly for the three-city cliques, Washington is included where several other cities ranked above it (e.g. Melbourne) in Table 2 are not. These variations from the rankings in Table 2 indicate that the structure of the world city network does not follow a simple hierarchical pattern based of connectivity ranking. This interpretation of the clique analysis can be enhanced through an analysis of the co-membership matrix, which ascertains the number of cliques in which two actors appear together. The latter matrix can thus be treated as an indicator of the extent to which actors belong together (Borgatti et al., 2002). Table 4 shows a small part of the co-membership matrix of the clique analysis at threshold 0.4, confirming that in world city cliques London and New York are everywhere. Furthermore patterns can be gleaned: Tokyo/Los Angeles and Paris/Milan appear to be city pairs that belong together. 3.c. Calibrating CliquishnessSearching for individual discrepancies between general ranking and particular clique memberships can be fruitful with relatively small numbers of cliques but it becomes too complex and burdensome as both the number of cliques increases and their membership sizes increase. And this is what happens, of course, when we lower the linkage threshold for slicing the matrix: this generates more and more inter-city links for analysis. Thus we require a method for calibrating city cliquishness. We informally identified cities with unusual levels of cliquishness in the last section by showing how they linked together with other cities more than we might expect from their global network connectivity rankings. This is because it is expected that degree of clique membership (proportion of total cliques that a city is a member of) will be closely related to global network connectivity. We use this relationship to define a relative measure of cliquishness. By regressing the number of clique memberships for each city against their global network connectivities we produce a linear model of this relationship. Residuals from this regression line will indicate deviations from the expected: a city with a positive residual is in more cliques than expected for its level of global network connectivity and a negative residual indicates the obverse. This is the measure of (relative) city cliquishness employed for all subsequent analyses. City cliquishness can be formally defined from the equation:
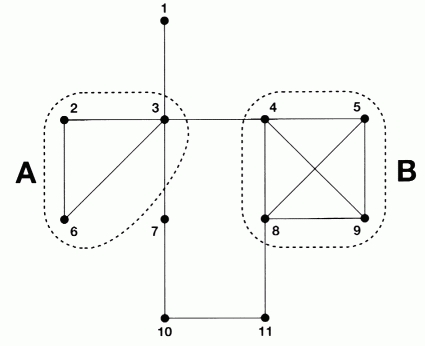
where y is the absolute number of clique memberships of a city, and x is its global network connectivity; R represents the residual and is our measure of relative cliquishness . Residuals are departures from the actual (y) and predicted (y) clique membership of a city, using equation (8) after calibrating the constants a and b:
Positive values of R indicate that a city is a member of more cliques than would be expected for its connectivity; negative values indicate less clique membership than expected. Thus the residuals provide a relative measure of city cliquishness. This calibration of cliquishness allows us to measure it for cities for different linkage thresholds. Thus a city can be over-linked at one level and under-linked at another. In this way we can begin to unravel the particular patterns of city cliquishness in the world city network. Below we investigate at linkage thresholds of 0.3 and 0.2ii. 4. WORLD CITY CLIQUES BY THRESHOLDOur previous discussion of results from a clique analysis with a linkage threshold of 0.4 can now be supplemented by including many more inter-city links. With the linkage threshold at 0.3 there are 39 cliques, while lowering the threshold to 0.2 produces a total of 55 cliques. We will continue our discussion by considering both clique analyses in turn. 4.a. Clique Analysis at Linkage Threshold of 0.30One of the most salient observations at linkage threshold 0.30 is that Tokyo and Hong Kong are over-cliqued and Paris is under-cliqued (Figure 3). This is largely the result of a number of Pacific Asian cities that are heavily inter-related at this fairly high threshold: four Pacific Asian cliques can be discerned, wherein Tokyo and Hong Kong appear to be intensively linked to Taipei, Jakarta, Beijing, and Bangkok (Appendix 1, cliques 9-12). This pattern demonstrates the important role Pacific Asia has come to play in the contemporary world-system and furthermore suggests that the major cities in this region are very exceptionally inter-related within the context of the world city network. Segal (1990, p. 377) has rightly stressed that one cannot merely assume a coherent Pacific region, since (t)here is no important cultural, ideological, political, or even military sense in which it is particularly useful to talk of the Pacific. While this denigrating reaction against Rimspeak (Cummings, 1994, p. 402) is understandable, their supposed incoherence is not always as straightforward as such dismissals advocate. This analysis suggests that some of the major Pacific Asian cities are indeed fairly coherently inter-related within the context of the world city network. Beyond the most connected world cities, it can also be observed that Chicago is over-cliqued, which can be traced back to the observation that, unlike Madrid, Chicago has strong linkages with Los Angeles, Toronto, San Francisco and Sydney (Appendix 1, cliques 3-5). This thorough inter-relatedness of North American and Pacific Asian furthermore hints at an important feature of the basic structure of the world city network, i.e. its important regional dimension. 4.b. Clique Analysis at Linkage Threshold of 0.20When the linkage threshold is lowered to 0.20, we can observe a pattern that is more or less the inverse of the pattern at linkage threshold 0.3 (Figure 4 ). European cities such as Milan, Amsterdam and Madrid are now over-cliqued, while North American cities such as Toronto, Los Angeles and San Francisco are under-cliqued at this linkage threshold. This inverse pattern is expressed through a number of Europan cliques, as exemplified by cliques 24 through 27, which articulate the inter-relatedness of European cities such as Milan, Amsterdam, Frankfurt, Brussels, Budapest, Vienna, Munich and Warsaw (see Appendix 2). In contrast, North America seems to be typified by a regional connectivity gap, e.g. there is only one clique that brings together important North American cities such as Chicago, Los Angeles, Toronto, and Montreal (Appendix 2, clique 23). An assessment of the clique-by-clique co-membership matrix reveals that the difference in cliquishness between, say, Milan and Los Angeles, disappears with respect to cities such as Montreal, Boston and San Francisco, while this gap in cliquishness is accentuated in the co-membership with cities such as Prague and Warsaw. Similar conclusions can be drawn from a comparison between Taipei (over-cliqued at this threshold) and San Francisco (under-cliqued at this threshold). Although both cities have approximately the same global network connectivity, an analysis of the clique-by-clique co-membership matrices reveals that San Francisco is heavily inter-related with cities such as Washington and Miami, whereas Taipei relations are more throrough with Jakarta, Kula Lumpur and Bangkok. 4.c. Interpretation of the Clique AnalysesConfronted with a data matrix as large and as multifaceted as this one, we do not expect to find simple definitive patterns, and as a consequence, we have applied the clique analyses as a tool to explore some basic patterns within the inherent complexity of the world city network. The first and foremost pattern is that world city cliques articulate an important regional dimension in the networked structure of cities around the world. This is a central result of this research, because it indicates that advanced producer service firms are not creating and reacting to a simple process of globalization leading to an overarching world city hierarchy. There is a multifaceted geography of cohesive sub-networks through which cities operate as service centres for global capital. Hence, as well as the commonplace notion that individual world cities represent critical local-global nexuses, there seem to be sub-networks that represent regional-global nexuses within contemporary globalization (see also Derudder et al., 2003). A second important pattern arises from a comparison between the clique analyses at linkage threshold 0.20 and 0.30 (see Figures 3-4), and refers to the dearth of North American cliques at linkage threshold 0.20. The relative lack of linkages at this intermediate connectivity level can be interpreted in two ways. First, this specific pattern hints at the distinctive horizontal city relations in the US city-system in contrast to the UK and Frances vertical city relations: whereas primate cities like London and Paris cast an inhibiting shadow over their compatriot cities, New York and Frankfurt have no such effect on other US/German cities. Second, this suggests that there appears to be a gap created in the globalization of US cities between the likes of relatively important cities such as Chicago, Los Angeles and San Francisco and less important cities such as Baltimore and Philadelphia. This relates to the sheer scale of the US economy and its long-developed, massive market in financial and business services that provides less of an incentive for firms to go global to the same degree as global service firms from other world regions. 5. CONCLUSIONSIt is important to note that the analysis presented above has been based on a narrow conception of world cities as global service centres, while it is self-evidently obvious that these great cities are much more than that. Smith and Timberlake (1995) have constructed a typology of inter-city linkages they think we should be studying. With three forms of flow human, material, information and four functions of flow economic, political, cultural, social they suggest 12 different types of linkages. The network analyses above fall into the information/economic type, but even here our subject matter represents only a small part of a large category. To understand global inter-city relations it is necessary to consider more than just economic processes, and the GaWC approach is being applied to other cultural, social and political world city network makers in work (Taylor 2004). In the present paper, however, we have focused on the analytical tools to analyse world city networks. Through their use of standard multivariate techniques to derive similarity groupings (e.g. PCA, cluster analysis), previous explorations of the world city network have unveiled world city configurations rather than world city networks. However, when the world city network is properly conceptualised as a social network, that is, as a form of organisation where nodes are actors and links are social relations, it becomes possible to analyse it just like any other more conventional network. This is exactly what we have attempted to show in this paper. More specifically, we have reported two sets of findings. First, we have shown how social network analysis can be applied to the world city network with the proper specification and appropriate technique adaptation. The result of this formal design is the construction of a proportionate relational matrix P, which can be conceived as the amalgam of persistent relationships between cities at the global scale. This proportionate relational matrix P has been derived from aggregated effects of the interactions between the firms through the seamless service they wish to provide. Second, we have described the network-analytical tools to analyse this proportionate relational matrix P, and employed this to produce some empirical findings on the networked structure of world cities. Due to the inherent simplifications that arise from dichotomising measures at various linkage thresholds, the clique analyses merely form a simple exploratory research design that is immensely flexible. Although this relational database is pregnant with many interesting connectivity profiles both at the level of individual world cities and through urban arenas that articulate critical global-regional nexuses this paper thus merely hinted at a small number of salient patterns. The main findings from the empirical analysis are the dominance of the New York-London dyad, and the observation that inter-city links at the global level retain an important regional dimension. The exemplary case here is the thorough inter-relatedness of important North American and Pacific Asian cities at threshold 0.30 and European cities at threshold 0.20. ACKNOWLEDGEMENTSAll clique analyses were carried out using UCINET software (Borgatti et al., 2002), while the network visualization in Figure 2 was derived through the embedded NetDraw visualization tool. We would like to thank the editor and three anonymous reviewers for helpful comments on earlier version of this paper. REFERENCESAlderson, A.S., Beckfield, J. (2004) 'Power and Position in the World City System', American Journal of Sociology, 109, 811-51. Borgatti, S.P., Everett, M.G., Freeman, L.C. (2002) Ucinet for Windows: Software for Social Network Analysis, Harvard: Analytic Technologies. Castells, M. (1996) The Rise of the Network Society, Oxford: Blackwell, Oxford. Cox, K.R. (1996) Introduction: globalization and its politics in question, in K.R. Cox (ed) Spaces of Globalization, New York: Guilford, 1-18. Cummings, B. (1994) What is a Pacific Century and how will we know when it begins?, Current History, 93, 401-406. Derudder, B., Taylor, P.J., Witlox, F., Catalano, G. (2003) 'Hierarchical Tendencies and Regional Patterns in the World City Network: A Global Urban Analysis of 234 Cities', Regional Studies, 37(9), 875-886. Faust, K., Entwisle, B., Rindfuss, R.R., Walsh, S.J., Sawangdee, Y. (2000) 'Spatial arrangement of social and economic networks among villages in Nang Rong District, Thailand', Social Networks, 21(4), 311-337. Frank, K.A. (1995) 'Identifying cohesive subgroups', Social networks, 17(1), 27-56. Friedmann J. (1986) 'The world city hypothesis', Development and Change, 17, 69-83. King, A.D. (1990) Global Cities: Post-Imperialism and the Internationalism of London, London: Routledge. Kresl, P.K. (1995) 'The determinants of urban competitiveness: a survey', in P.K. Kresl and G. Gappert (eds) North American Cities and the Global Economy, London: Sage, 45-68. Lai, G. (2001) 'Social support networks in urban Shanghai', Social Networks, 23(1), 73-85. Sassen S. (1995) 'On concentration and centrality in the global city', in P.L. Knox and P.J. Taylor (eds) World Cities in a World-System, Cambridge: Cambridge University Press, 67-78. Sassen, S. (2000) Cities in a World Economy, Thousand Oaks (CA): Pine Forge. Sassen, S. (2001) The Global City: New York, London, Tokyo, Princeton: Princeton University Press. Scott, J. (1991) Social Network Analysis, London: Sage. Segal, G. (1990) Rethinking the Pacific, Oxford: Clarendon Press. Shin, K.H., Timberlake, M. (2000) World cities in Asia: cliques, centrality and connectedness, Urban Studies, 37(12), 2257-2285. Short, J.R., Kim, Y., Kuss, M., Wells, H. (1996) The Dirty Little Secret of World City Research, International Journal of Regional and Urban Research, 20, 697-717. Smith, D.A., Timberlake, M. (1995) 'Cities in Global Matrices: toward mapping the world-system's city-system', in P.L. Knox and P.J. Taylor (eds) World Cities in a World-System, Cambridge: Cambridge University Press, 79-97. Smith, D.A., Timberlake, M. (2001) World city networks and hierarchies 1979-1999: an empirical analysis of global air travel links, American Behavioral Scientist, 44, 1656-1677. Smith, D.A., Timberlake, M. (2002) Hierarchies of dominance among world cities: a network approach, in: S. SASSEN (ed.) Global networks, Linked cities, London: Routledge, 117-141. Taylor, P.J. (1997) 'Hierarchical tendencies amongst world cities: a global research proposal', Cities, 14, 323-32. Taylor, P.J. (2001) 'Specification of the world city network', Geographical Analysis, 33(2), 181-94. Taylor, P.J. (2004) World City Network: a Global Urban Analysis, London: Routledge. Taylor, P.J., Hoyler, M., Walker, D.R.F., Szegner, M.J. (2001) 'A New Mapping of the World for the New Millennium', The Geographical Journal, 167(3), 213-222. Taylor, P.J., Catalano, G., Walker D.R.F. (2002) 'Measurement of the World City Network', Urban Studies, 39(13): 2367-76. NOTES* Ben Derudder, Department of Geography, Ghent University, Belgium. Email: ben.derudder@rug.ac.be ** Peter Taylor, Department of Geography, Loughborough University, UK. Email: p.j.taylor@lboro.ac.uk i Sassen uses the term global city to describe these cities, here we treat this as interchangeable with world city. ii The following technical note is necessary for those who would replicate these analyses. The method we have developed relies on the model relationship being linear and this is ensured by omitting two sets of outlier cities at the tails of the distribution of the clique membership variable. First, London and New York are omitted because they are in all cliques - their proportional membership is always 1, far higher than all other cities, making them clear outliers in the regression analysis. Second, at the other tail of the variable we omit all cities ranked below the first city to be recorded with no clique membership. We found this was necessary through initial experiments with the data: in large clique analyses there are some relatively poorly connected cities that have a single clique membership forming a cluster of outliers that distort the models linearity. Table 1: Excerpt of proportional relational matrix P.
Table 2: Absolute and relative global network connectivities for the 50 most connected cities in the world city network.
Table 3: Clique analysis at linkage threshold 0.40.
Table 4: Excerpt from clique-by-clique co-membership matrix at linkage threshold 0.40.
Figure 1: Cliques as complete graphs (Taylor, 2004, p. 117)
Figure 2: Visualization of the world city network at threshold 0.40. Tie strength has been based on the thoroughness of the inter-city links; the size of the nodes is based on the GNC.
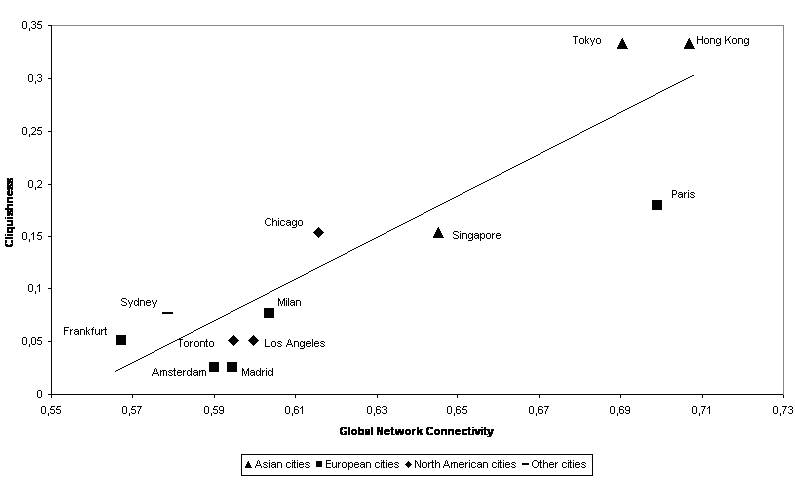
Figure 3: Cliquishness versus Global Network Connectivity at linkage threshold 0.3.
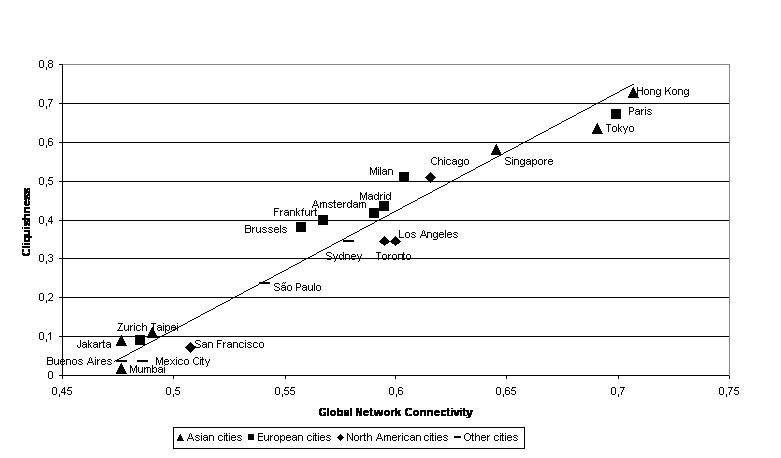
Figure 4: Cliquishness versus Global Network Connectivity at linkage threshold 0.2.
Appendix 1: World city cliques at linkage threshold 0.30. 1: London New York Hong Kong Paris Tokyo Singapore Chicago Milan Madrid Amsterdam Frankfurt Brussels 2: London New York Hong Kong Paris Tokyo Singapore Chicago Milan Sydney Frankfurt 3: London New York Hong Kong Paris Tokyo Singapore Chicago Milan Toronto Sydney 4: London New York Hong Kong Paris Tokyo Singapore Chicago Los Angeles Toronto Sydney 5: London New York Hong Kong Paris Tokyo Singapore Chicago Los Angeles San Francisco 6: London New York Hong Kong Paris Tokyo Singapore Chicago Sao Paulo 7: London New York Hong Kong Paris Tokyo Zurich 8: London New York Hong Kong Tokyo Mexico City 9: London New York Hong Kong Tokyo Taipei 10: London New York Hong Kong Tokyo Jakarta 11: London New York Hong Kong Tokyo Bangkok 12: London New York Hong Kong Tokyo Beijing 13: London New York Hong Kong Buenos Aires 14: London New York Mumbai 15: London New York Melbourne 16: London New York Miami 17: London New York Kuala Lumpur 18: London New York Stockholm 19: London New York Prague 20: London New York Dublin 21: London New York Tokyo Shanghai 22: London New York Barcelona 23: London New York Atlanta 24: London New York Moscow 25: London New York Istanbul 26: London New York Washington 27: London New York Auckland 28: London New York Vienna 29: London New York Warsaw 30: London New York Seoul 31: London New York Lisbon 32: London New York Johannesburg 33: London New York Copenhagen 34: London New York Budapest 35: London New York Manila 36: London New York Montrea l37: London New York Munich 38: London New York Düsseldorf 39: London New York Boston Appendix 2: World city cliques at linkage threshold 0.20. 1: London New York Hong Kong Paris Tokyo Singapore Chicago Milan Los Angeles Toronto Madrid Amsterdam Sydney Frankfurt Brussels Sao Paulo Zurich Taipei Jakarta 2: London New York Hong Kong Paris Tokyo Singapore Chicago Milan Los Angeles Toronto Madrid Amsterdam Sydney Frankfurt Brussels Sao Paulo Taipei Jakarta Kuala Lumpur 3: London New York Hong Kong Paris Tokyo Singapore Chicago Milan Los Angeles Toronto Madrid Amsterdam Sydney Frankfurt Brussels Sao Paulo Taipei Jakarta Bangkok 4: London New York Hong Kong Paris Tokyo Singapore Chicago Milan Los Angeles Toronto Madrid Amsterdam Sydney Frankfurt Brussels Sao Paulo Taipei Jakarta Beijing 5: London New York Hong Kong Paris Tokyo Singapore Chicago Milan Los Angeles Toronto Madrid Amsterdam Sydney Frankfurt Brussels Sao Paulo Taipei Mumbai 6: London New York Hong Kong Paris Tokyo Singapore Chicago Milan Los Angeles Toronto Madrid Amsterdam Sydney Frankfurt Brussels Sao Paulo Zurich Taipei Buenos Aires 7: London New York Hong Kong Paris Tokyo Singapore Chicago Milan Los Angeles Toronto Madrid Amsterdam Sydney Frankfurt Brussels Sao Paulo San Francisco Mexico City Zurich Jakarta 8: London New York Hong Kong Paris Tokyo Singapore Chicago Milan Los Angeles Toronto Madrid Amsterdam Sydney Frankfurt Brussels Sao Paulo San Francisco Mexico City Zurich Buenos Aires 9: London New York Hong Kong Paris Tokyo Singapore Chicago Milan Los Angeles Toronto Madrid Amsterdam Sydney Frankfurt Brussels Sao Paulo San Francisco Melbourne Miami 10: London New York Hong Kong Paris Tokyo Singapore Chicago Milan Los Angeles Toronto Madrid Amsterdam Sydney Frankfurt Brussels Sao Paulo Seoul 11: London New York Hong Kong Paris Tokyo Singapore Chicago Milan Los Angeles Madrid Amsterdam Sydney Frankfurt Brussels Sao Paulo Shanghai 12: London New York Hong Kong Paris Tokyo Singapore Chicago Milan Madrid Amsterdam Sydney Frankfurt Brussels Prague 13: London New York Hong Kong Paris Tokyo Singapore Chicago Milan Madrid Amsterdam Sydney Frankfurt Brussels Moscow 14: London New York Hong Kong Paris Tokyo Singapore Chicago Milan Los Angeles Toronto Madrid Amsterdam Sydney Brussels Sao Paulo Zurich Stockholm 15: London New York Hong Kong Paris Tokyo Singapore Chicago Milan Madrid Amsterdam Brussels Istanbul 16: London New York Hong Kong Paris Tokyo Singapore Chicago Milan Madrid Amsterdam Brussels Lisbon 17: London New York Hong Kong Paris Tokyo Singapore Chicago Milan Toronto Madrid Amsterdam Brussels Sao Paulo Johannesburg 18: London New York Hong Kong Paris Tokyo Singapore Chicago Milan Los Angeles Toronto Madrid Amsterdam Sydney Frankfurt Barcelona 19: London New York Hong Kong Paris Tokyo Singapore Chicago Milan Los Angeles Toronto Madrid Amsterdam Sydney Frankfurt Atlanta 20: London New York Hong Kong Paris Tokyo Singapore Chicago Milan Los Angeles Toronto Madrid Sydney Brussels Dublin 21: London New York Hong Kong Paris Tokyo Singapore Chicago Milan Los Angeles Toronto Madrid Sydney Frankfurt Brussels San Francisco Washington 22: London New York Hong Kong Paris Tokyo Singapore Chicago Milan Madrid Auckland 23: London New York Hong Kong Paris Tokyo Singapore Chicago Milan Los Angeles Toronto Montreal 24: London New York Hong Kong Paris Tokyo Singapore Milan Toronto Amsterdam Vienna 25: London New York Hong Kong Paris Tokyo Singapore Milan Madrid Amsterdam Frankfurt Brussels Warsaw 26: London New York Hong Kong Paris Tokyo Singapore Milan Amsterdam Frankfurt Brussels Budapest 27: London New York Hong Kong Paris Tokyo Singapore Milan Frankfurt Munich 28: London New York Hong Kong Paris Tokyo Singapore Chicago Madrid Amsterdam Sydney Manila 29: London New York Hong Kong Paris Tokyo Singapore Frankfurt Hamburg 30: London New York Hong Kong Paris Tokyo Singapore Chicago Los Angeles Frankfurt Dusseldorf 31: London New York Hong Kong Paris Tokyo Frankfurt Berlin 32: London New York Hong Kong Paris Tokyo Caracas 33: London New York Hong Kong Paris Tokyo Luxembourg 34: London New York Hong Kong Paris Singapore Milan Copenhagen 35: London New York Hong Kong Paris Rome 36: London New York Hong Kong Paris Bogota 37: London New York Hong Kong Paris Santiago 38: London New York Hong Kong Tokyo Chicago New Delhi 39: London New York Hong Kong Tokyo Singapore Chicago Los Angeles Toronto Boston 40: London New York Hong Kong Chicago Dallas 41: London New York Dubai 42: London New York Athens 43: London New York Cairo 44: London New York Houston 45: London New York Beirut 46: London New York Vancouver 47: London New York Oslo 48: London New York Geneva 49: London New York Seattle 50: London New York Rio De Jan 51: London New York Helsinki 52: London New York Denver 53: London New York Philadelphia 54: London New York Minneapolis 55: London New York Ho Chi Minh Edited and posted on the web on 23rd May 2003; last update 4th April 2005
Note: This Research Bulletin has been published in Global Networks, 5 (1), (2005), 71-91 |
|||||||||||||||||||||||||||||||||||||||||||||||||||||||||||||||||||||||||||||||||||||||||||||||||||||||||||||||||||||||||||||||||||||||||||||||||||||||||||||||||||||||||||||||||||||||||||||||||||||||||||||||||||||||||||||||||||||||||||||||||||||||||||||||||||||||||||||||||||||||||||||||||||||||||||||||||||||||||||||||||||||||||||||||||||||||||||||||||||||||||||||||||||||||||||||||||||||||||||||||||||||||||||||||||||||||||||||||||||||||||||||||||||||||||||||||||||||||||||||||||||||||||||||||||||
 (8)
(8)
 (9)
(9)