
GaWC Practitioner Brief 4 |
|
|
London is a leading world city. In a recent review of the world cities literature London was one of only four cities cited by all sources.1 And, of course, London is one of Saskia Sassen’s famous trinity of ‘global cities’.2 Thus the point is not whether London is a major world city but how it operates as a world city. And it is at this step in the argument that the certainties give way to many unanswered questions. Most definitions of world cities have relied upon such factors as the number of corporate headquarters, the size of capital markets, and the quantity of international institutions located within a city. These are important features of world cities but we can never understand any city in terms of just its stock of functions and practices. Cities are the crossroads of society: they exist through their connections. And it is precisely in this respect that our knowledge has been found to be wanting. Public statistics provide much information on the attributes of cities but very little on the flows between cities. This is, of course, a disabling lacuna for understanding world cities as nodes in a global space of flows as famously envisaged by Manuel Castells.3 This problem has been widely recognised, not least with respect to London: indeed in the Coopers & Lybrand Deloitte report, this point was made explicitly. The report concluded that to ensure wealth creation a world city must ‘develop and enhance global links and relations’ but it was concerned that there was little or no evidence on London’s relations with other cities.4 The Globalization and World Cities (GaWC) Study Group and Network5 has been formed specifically to tackle the problem of the dearth of data on inter-city relations. Concerned not just with London but with cities across the world, researchers have (i) created original data sets resulting in (ii) new global urban analyses based upon (iii) a fresh conceptualisation of world cities as part of a worldwide service network. In order to understand how this GaWC research can enhance our knowledge of London as a world city, these three research steps are detailed.
This exercise shows London to have the highest global network connectivity. Further results from this research are given in Figure 1. This cartogram depicts the 123 cities with highest connectivities; all have a global network connectivity score of at least one fifth of the highest computed score, that of London.10 The general pattern is not surprising although there has been no such comprehensive empirical assessment of world cities worldwide before. The three main globalization arenas – northern America, western Europe and Pacific Asia – dominate Figure 1 with Latin America the only other world region with much representation. Africa and south Asia are weakly represented, central Asia is completely missing. This map confirms the geographical unevenness of economic globalization. Focussing on the highest ranked cities, Table 1 shows London to be just ahead of New York in global network connectivity with other cities, including Tokyo, quite a distance behind. In fact Tokyo, despite its ‘global’ attribution by Sassen, is shown to be below both Hong Kong and Paris in this first large-scale empirical assessment of city connectivities. However, when we use just the banking and financial firms to compute connectivity, the pattern changes. Table 1 shows that for ‘banking connectivity’ it is the same six cities that hold the highest ranks but their ordering is changed. London still has the highest connectivity but the other cities close the gap. Tokyo, in particular, jumps to third place and with this measure seems to fit in better as one of Sassen’s three ‘global cities’. Clearly what is happening here is that London and New York are much more ‘rounded’ world cities with high connectivities across the whole spectrum of business services whereas Tokyo’s position in the network is much more based on its role as an international financial centre. In the world city network of 123 cities all cities are connected to some degree to all other cities. This is the nature of a network. This makes traditional approaches to cities by geographers and planners in which distinct city hinterlands are identified quite problematic. Not only are London and New York ‘global’ in their connections, so too are Lima, Lagos and Kuala Lumpur. Business adoption of IT systems means that boundaries designating a city’s ‘sphere of influence’ are exceedingly porous. We can say that ‘all world cities are global but some are more global than others’. This means that instead of looking for hinterlands we need to measure the ‘hinterworlds’ of cities, the distribution of where a city is strong and where it is weak in terms of its inter-city relations. Thus rather than delineating hinterland boundaries we describe a worldwide hinterworld distribution. We use the basic data matrix again to compute connectivity between pairs of cities and compare these results with that expected in terms of the global network connectivities of cities. Differences from the expected show where a city is relatively over-linked and where it is relatively under-linked. London’s hinterworld is illustrated in Figure 2. This is a completely new map of London’s position within the world city network never been illustrated before. Several features stand out.
We can summarise by saying that London’s hinterworld has a clear bias towards the leading cities in the main globalization arenas, especially Pacific Asia. This pattern is both global and new: there is neither a local regional (European) bias nor are there any vestiges of London’s imperial past. What does this all mean for London? A superficial reading of Figure 1 and Table 1 would see London as leading in a worldwide competition between cities. Certainly London’s position as Europe’s ‘global city’ seems secure on these figures – Paris lags behind as we have seen and Frankfurt and Brussels are even further back in the competition with global connectivity rankings of 15h and 16th respectively. But is this really how world cities operate? We have specified world cities as part of an interlocking network. Networks can only operate in a situation of cooperation because it is mutuality amongst nodes that ultimately sustains the network. Hence under conditions of contemporary globalization, we should no longer view cities in the traditional manner as part of competitive hierarchies, rather the message of this research is to consider them as part of a network in which cooperative tendencies are vitally important. Thus London is not at the apex of a European hierarchy of world cities, it is the most connected European city within a worldwide network of cities. The policy implications are that world cities like London are not well served by simply aggregating more activities in situ, it ultimately needs to build upon to its mutual interests with other cities. In other words London has to attend to its position within the world city network, which is why defining the city’s hinterworld is important. 1. This unanimity covered 15 sources - see Table 2 (pp. 448-9) in Beaverstock, J.V., Smith R.G. and Taylor, P. J. (1999) ”A roster of world cities” Cities 16, 445-58. The other three were New York, Paris and Tokyo. 2. Hugely influential when first published in 1991 it is now in its second edition: Sassen, S. (2000) The Global City: New York, London and Tokyo. Princeton, NJ: Princeton University Press. 3. Part of an ambitious trilogy on ‘network society’ in an ‘informational age’ and first published in 1996, it is now in its second edition: Castells, M (2000) The Rise of the Network Society. Oxford: Blackwell. 4. HMSO (1991) London.World City moving into the 21st Century. London: HMSO. 5. Located in the Department of Geography, Loughborough University and the Metropolitan Institute at Virginia Tech, GaWC operates as a virtual centre for world city research: http://www.lboro.ac.uk/gawc/ 6. Details can be found in Taylor, P J (2001) ‘Specification of the world city network’ Geographical Analysis 33, 181-94. 7. We refer to these as the ”GaWC 100” and they were selected on the basis of having offices in at least 15 different cities including at least one from each of northern America, western Europe and Pacific Asia. Their distribution across sectors is: 18 firms in accountancy, 15 in advertising, 23 in banking/finance, 11 in insurance, 16 in law, and 17 in management consultancy. 8. Details of the methodology can be found in Taylor, P. J., Catalano, G. and Walker, D. R. F. (2002) ‘Measurement of the world city network’ Urban Studies (forthcoming, available at http://www.lboro.ac.uk/gawc/rb/rb43.html) 9. Op cit. 10. The scores are very large numbers and to make them more easily interpretable they are converted to proportions of the highest score to provide a scale from 0 (three cities had no firm’s presences and thus a score of zero) to 1.0 for London. Table 1: Ranking cities by connectivity
Figure 1: GLOBAL NETWORK CONNECTIVITY Cities are placed in their approximate relative geographical positions. AB Abu Dubai; AD Adelaide; AK Auckland; AM Amsterdam; AS Athens; AT Atlanta; AN Antwerp; BA Buenos Aires; BB Brisbane; BC Barcelona; BD Budapest; BG Bogota; BJ Beijing; BK Bangkok; BL Berlin; BM Birmingham; BN Bangalore; BR Brussels; BS Boston; BT Beirut; BU Bucharest; BV Bratislava; CA Cairo; CC Calcutta; CG Calgary; CH Chicago; CL Charlotte; CN Chennai; CO Cologne; CP Copenhagen; CR Caracas; CS Casablanca; CT Cape Town; CV Cleveland; DA Dallas; DB Dublin; DS Dusseldorf; DT Detroit; DU Dubai; DV Denver; FR Frankfurt; GN Geneva; GZ Guangzhou; HB Hamburg; HC Ho Chi Minh City; HK Hong Kong; HL Helsinki; HM Hamilton(Bermuda); HS Houston; IN Indianapolis; IS Istanbul; JB Johannesburg; JD Jeddah; JK Jakarta; KC Kansas City; KL Kuala Lumpur; KR Karachi; KU Kuwait; KV Kiev; LA Los Angeles; LB Lisbon; LG Lagos; LM Lima; LN London; LX Luxembourg; LY Lyons; MB Mumbai; MC Manchester; MD Madrid; ME Melbourne; MI Miami; ML Milan; MM Manama; MN Manila; MP Minneapolis; MS Moscow; MT Montreal; MU Munich; MV Montevideo; MX Mexico City; NC Nicosia; ND New Delhi; NR Nairobi; NS Nassau; NY New York; OS Oslo; PA Paris; PB Pittsburgh; PD Portland; PE Perth; PH Philadelphia; PL Port Louis; PN Panama City; PR Prague; QU Quito; RJ Rio de Janeiro; RM Rome; RT Rotterdam; RY Riyadh; SA Santiago; SD San Diego; SE Seattle; SF San Francisco; SG Singapore; SH Shanghai; SK Stockholm; SL St Louis; SO Sofia; SP Sao Paulo; ST Stuttgart; SU Seoul; SY Sydney; TA Tel Aviv; TP Taipei; TR Toronto; VI Vienna; VN Vancouver; WC Washington DC; WL Wellington; WS Warsaw; ZG Zagreb; ZU Zurich Figure 2: LONDON’S HINTERWORLD (City codes as in Figure 1) 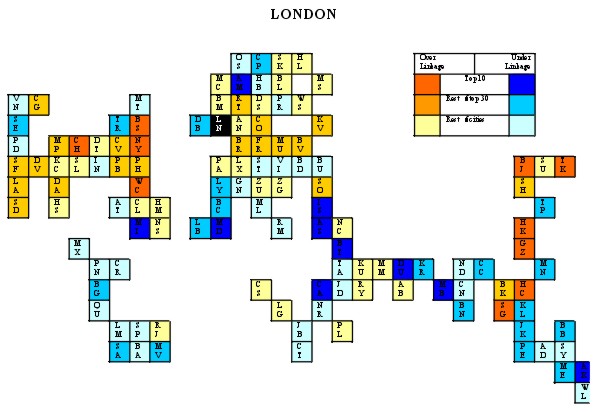
Edited and posted on the web on 19th June 2002 Note: This Practitioner Brief has been published in Planning in London, 42 (July/Sept. 2002), 29-31 |
|||||||||||||||||||||||||||||||||||||||||||||||||
 The codes for cities are: