
Modelling and Simulation
Project: Insight Benefits of Interaction in Visual Analytics
Summary
Visual Analytics is a multi-disciplinary field that uses interactive visualisations to promote and assist the analytic reasoning and generate insights. Understanding the perceptual and cognitive factors is key to the progress in this field. This research focuses on understanding the benefits of interaction in terms of insight generation. Moreover, this investigation explores the compounding effects individual differences have with interaction when analysing data to generate insights. This study investigated the individual differences in two sets; psychometric set measures, and a sensorial preferences multimodal learning style.
Aims and Objectives
The research is studying interaction as an independent variable in the context of VA, in order to evaluate its benefits in terms of insight generation. Also this research investigated the compounding effects individual differences have with interaction within this context.
Objective One: Investigate the effects of Visual Mapping Interaction in the context of performing an analytical task using information visualisation.
Objective Two: Investigate the compounding effects of Visual Mapping Interaction with performance-related psychometric measures (Locus of Control, Self-efficacy, & Self-acceptance) and the VARK model of learning styles in the context of performing an analytical task using information visualisations.
Objective Three: Investigate the effects of View Transformation Interaction in the context of a problem-solving task, where View Transformation Interaction is used to explore the problem data-set using a game-based simulation using a 2D and 3D visual representation.
Objective Four: Investigate the compounding effects of View Transformation Interaction with the performance-related psychometric measures (Locus of Control, Self-efficacy, & Self-acceptance) and the VARK model of learning styles; in the context of a problem-solving task, where View Transformation Interaction is used to explore the problem data-set using a game-based simulation using a 2D and a 3D visual representation.
Results
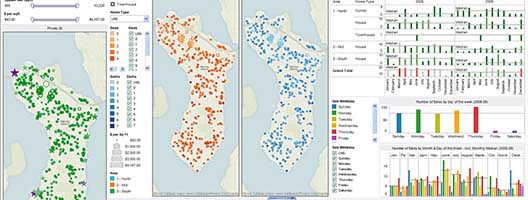
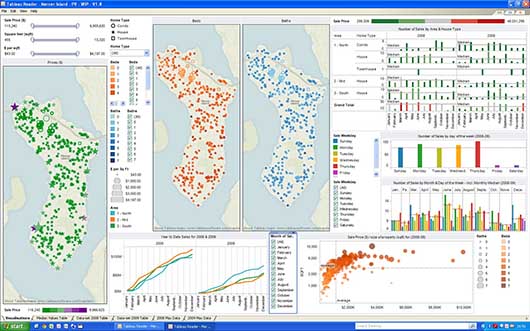 Example Interactive Visual Analytics Screen
1. Visual mapping interaction effects:
With regards to the visual mapping interaction this thesis contributes by affirming that interaction increases insight generation, increasing the mean by 60%. Additionally, this research shows that interaction improved the accuracy of insights generated, by a mean improvement close to 60%. Further, it proposes that interaction facilitates the generation of insights requiring a lower mental effort, where the increase was 55% when compared to an equivalent non-interactive task.
2. Compound effects of visual mapping interaction with performance-related psychometric measures (LoC, SE, & SA) and the VARK model of learning styles:
This research contributes, by identifying compounding effects between interaction and self-efficacy, where SE facilitates the generation of low mental effort insights. Whereby, for the participants with above mean SE measures, interaction decreased their mental effort yield, defined as the difference between high and low mental efforts, by over 65%. Other contributions are that no significant effect were attributable to locus of control or self-acceptance measures.
With regards to the VARK model of learning styles, this investigation contributes by demonstrating an overall accuracy trend related to compounding effects with the visual preference, increasing the accuracy of insights proportionally with the increase in the visual score. For above mean visual users, the increase in their accuracy yield (difference between accurate and inaccurate insights) was close to 200%. Additionally, interaction has a negative correlating trend related to the read-write preferences, effectively dropping by 100% the number of accurate insights requiring a lower mental effort procedural tasks between the users with low and high levels of read-write preference.
3. View transformation interaction effects in the context of 2D & 3D visual representations:
With regards to the view transformation interaction, this thesis confirms that in the context of a ‘serious games’ a problem-solving interactive exploration increases the number of accurate insights gathered by 15%, reduces the inaccurate insights by 20%, and improves the performance score by 13%.
When looking at the visual representation in isolation, the results show that interaction in a 2D representation provides 15% more accurate insights than watching a video walkthrough of the problem set, reduces by 40% the number on unidentified (unnoticed, ‘missed’) insights and improves the overall has performance score by 12%. Equally, interaction in a 3D representation increased the performance score by 15%, whilst having no significant effects on the accuracy or identification of insights.
When comparing the performance scores of interaction in 2D versus a 3D representation, interaction in a 2D representation outperformed 3D by 6% overall and specifically by 8% in the number of accurate insight whilst reducing by 20 % the inaccurate insights.
4. Compounding effects of view transformation interaction with performance-related psychometric measures (LoC, SE, & SA) and the VARK model of learning styles, in the context of 2D & 3D visual representations:
The results of this thesis show that view transformation interaction has a conjoint effect with all the performance-related psychometric measures studied namely Locus of Control, Self-Efficacy, Self-Acceptance and the VARK single sensory modes. Whereby, low self-efficacy individuals benefited from the view transformation interaction by improving their performance score by 19% and 16.5% within 2D and 3D respectively. The external locus of control individuals benefited from interaction within a 3D representation only improving their performance score by 15%. Whereas, the low self-acceptance users increased their performance by 17% in using the 2D and the high self-acceptance user improved their performance by 15% using the 3D. Regarding the VARK learning preferences single sensory modes. For users with high levels of visual learning preference, interaction increased their performance score by 13% and 16% within 2D and 3D respectively. For the participants with high levels of read-write learning preference, interaction had a very large compensating effect in the 3D representation by increasing their score by 32%. Finally the participants with high kinaesthetic learning preference, benefited from interaction by increasing their performance score using 3D by 14%.
Conclusions and Impact
The key contribution of this research is the tangible proof of the benefits of both the Visual Mapping and View Transformation Interaction in visual analytics. Strengthens the view held by the visual analytics community that interaction with the problem-set, improves the understanding and amount of insights gleaned into the problem. Further, this thesis indicates that within the context of this study a representation of the problem set using a game-based simulation, is more effective in 2D than 3D. Finally, these findings contribute to justify the measurement and use of performance-related psychometric such as Locus of Control self-efficacy and self-acceptance in addition to the VARK learning preferences constructs as performance predictors for visual analytics. Further, the results of this investigation, provides profiling and selecting measures, that can be used to identify high performing visual analysts.
Want to Know More?
Professor Roy S. Kalawsky, r.s.kalawsky@lboro.ac.uk, +44 (0)1509 63 5678
Dr Petri Vitiello, P.F.Vitiello@lboro.ac.uk, +44(0) 1509 635673