
Environment
Predicting Water Supply/Demand Across a 10 Year Cycle Through Visual Analytics
Overview
The changing global climate and growing population is challenging the resilience water supply systems across the world. The UK is no different; in recent years there have been periods of drought across a number of regions and at times periods of floods. Coupling this dynamic scenario with other issues facing the water supply industry, such as ageing infrastructure, which is leading to leaks and other supply failures places huge demands on the water supply companies to manage this essential resource. This project describes the data mining and modeling of domestic water demand based on previous consumption profile and weather forecasts. One of the objectives of the research has been to see if it is possible to use visual analytics as a means of predicting future demand against short-medium term meteorological forecasts. This project has addressed new ways of presenting information to water engineers to help them manage their network.
The Challenge
Visual analytics has been an emerging field over recent years and has been playing a key role in providing insights into the complex relationships and interactions of systems across a number of domains. Analysis of water supply is relatively straightforward provided appropriate instrumentation is in place but analysis of demand is difficult. However, in order to manage a water supply network ensuring maximum efficiency whilst minimizing cost to the user base requires the supply – demand system to be carefully controlled.This research is attemnpting to meet this challenge by finding new ways to understand real sensed data with predicted data across a diverse information set. Visual analytics has been an emerging field over recent years and has been playing a key role in providing insights into the complex relationships and interactions of systems across a number of domains.
An interesting aspect of this research is that from a control system perspective there are many control loops that through necessity run very slowly. For instance, it takes an appreciable time for the pumps of a reservoir to switch on and deliver a water supply to a remote location several kilometers away. Also, tight legislative controls on water quality place extremely stringent demands on the water supply network as a whole.
Aims & Objectives
One of the objectives of the research has been to see if it is possible to use visual analytics as a means of predicting future demand against short-medium term meteorological forecasts. Visual analytics has been an emerging field over recent years and has been playing a key role in providing insights into the complex relationships and interactions of systems across a number of domains. Analysis of water supply is relatively straightforward provided appropriate instrumentation is in place but analysis of demand is difficult. However, in order to manage a water supply network ensuring maximum efficiency whilst minimizing cost to the user base requires the supply – demand system to be carefully controlled. An interesting aspect of this research is that from a control system perspective there are many control loops that through necessity run very slowly. For instance, it takes an appreciable time for the pumps of a reservoir to switch on and deliver a water supply to a remote location several kilometers away. Also, tight legislative controls on water quality place extremely stringent demands on the water supply network as a whole. This project has addressed new ways of presenting information to water engineers to help them manage their network.
Methodology
There has been considerable research trying to address the challenge of maintaining a secure and resilient water supply. For example, short and long-term predictive models are currently used and are based upon long-term weather trends. However, due to climate changes this approach has frequently proved to be unreliable. Also, water demand is complicated by many other inter-related factors, which need to be considered. Therefore, the research in this project has considered how the multiplicity of information sources (obtained from sensors within a water network region) can be correlated with short-term meteorological and other data to gain greater insights into the inter-relationships.
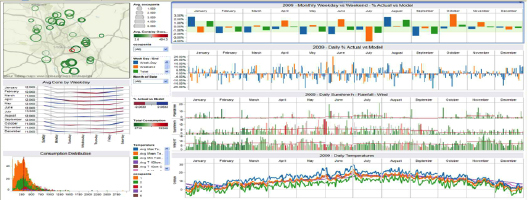
The basis for the underpinning data comprised 10 years of water daily consumption data for 166 households and the associated weather daily data (temperatures, rainfall, sunshine hours and wind speed) from 4 local weather stations. Additional data included soil temperature at different depths (10,30 and 100 cm). Analysis of large data sets typically involves the use of powerful statistical analysis tools that present results in often difficult to understand formats (at least to non-statistic specialists). Consequently, the process of data exploration has been the subject of this research with a view to providing effective analysis tools with a methodology of use. Data is prepared and transformed for analysis using ‘join and split’ functions and then augmented, by creating consumption and weather related moving averages.
Most interactive visualization approaches follow process shown in Figure 1. However, this can be extremely limiting when dealing with complex relationships between variables.
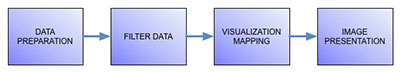
Figure 1: Model, Simulate and Visualization Workflow
Therefore, this project developed a novel process based on visual analytics known as the ‘sensemaking framework’ (Ref [1]. This process was adapted from Keim [2] and Klein et al [3] shown in Figure 2.
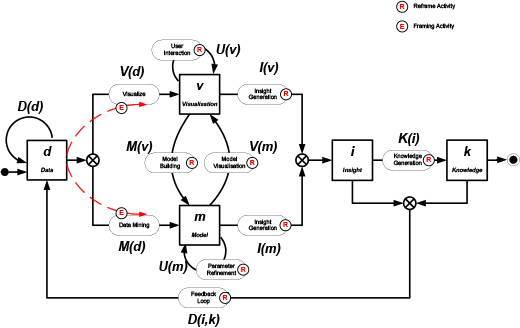
Figure 2: Sensemaking Process adapted from Ref [2] and [3].
By performing the elaboration and reframing cycles to glean insights into the data structure and feeding back into the data preparation. Then, data were visualized and mined to understand the existing relationships. These included distribution visualization of all the variables and interactive visual exploration using brushing techniques to uncover top- level relationships. Subsequent steps included correlation analysis and stepwise regression modeling to understand and explore the different schemas as part of the data mining stage of the process.
During these cycles, insights and knowledge about the system were generated, in particular, information relating to the lack of individual correlation between household consumption and weather. Also it uncovered seasonal consumption and weather trends. The data was then augmented, by creating consumption and weather related moving averages. Exploring these new frames resulted in a deeper understanding of the short-term latency of the system.
This process led naturally to explore and analyze clusters according the geo-locality and household occupancy. The new aggregation based frames were very fruitful, leading to interesting results enabling the modeling of the water demands for these clusters, based on short-term weather forecasts. Based on the transformed data and the predictive model, visualization tools were used to visually interact with the data in order to understand the model sensitivity and scope. The interactive process allowed the model to be refined whilst generating more insights regards to the seasonal accuracy, and weekly patterns of water supply/demand. The interactive visualization views enabled the exploration of the relationship between values and attributes.
Results
The results for one cluster, stemming from the regression analysis on consumption trends yield a value of R2 of 62% when adding seasonal aspects it increased to 69.5% improving the model by 7.5% then adding the weather considerations it yielded a 72.5% R2 value which is an increase of 3% explained by the weather aspects. When the process of exploration and sense-making was further extended, we observed by interacting with the data that above 10% error was mainly occurring in the lower consumption days leading to the insights that the model was over-estimating the low consumption aspects and thus opened new avenues for investigation and adaptation of the model.
In dealing with huge data sets spanning one or decades a very large interactive visualization system proved essential to explore large amounts of longitudinal time based data. Such systems are required to spot trends in data that would otherwise be missed if displayed on a desk-top system, refer to Figure 3.
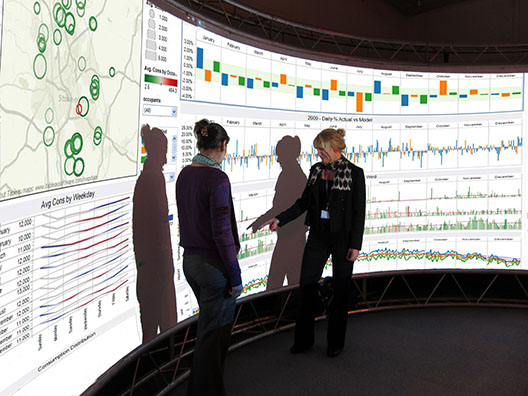
Figure 3: Large Interactive Visualization System to Interact with Huge Datasets
Conclusions
Results from this project have shown the important utility of visual analytics when coupled with appropriate tools and interactive visualization systems to help engineers assemble an understanding of complex relationships between data from different domains. Whilst the tools are important, the process and workflow of the tools is equally if not more important in achieving a high level of understanding. A visual analytic based sense-making framework provides the means to rapidly gain valuable insights into the data. This visual analytic approach has enabled the modeling of the water demand based on short-term weather forecast. Additionally providing an understanding of the interaction and relationships between the water demand and weather system.
[1] P. F. Vitiello and R. S. Kalawsky, “Visual analytics: A sensemaking framework for systems thinking in systems engineering,” 2012 IEEE International Systems Conference SysCon 2012, pp. 1–6, Mar. 2012.
[1] D. A. Keim, “Mastering the information age: solving problems with visual analytics,” 2011.
[2] G. Klein, J. Phillips, E. Rall, and D. A. Peluso, “A data-frame theory of sensemaking,” in Expertise out of context: Proceedings of the sixth international conference on naturalistic decision making, 2003, pp. 113–155.
Acknowledgements
Loughborough University wishes to thank Seven Trent Water for supplying the source data for this project and for many helpful discussions.
Want to know more?
Contact:
Professor Roy S. Kalawsky, r.s.kalawsky@lboro.ac.uk, +44 (0)1509 63 5678
Dr Petri Vitiello, P.F.Vitiello@lboro.ac.uk, +44(0) 1509 63 5673