GaWC Research Bulletin 227 |
|
|
|
This Research Bulletin has been published in International Journal of Urban and Regional Research, 33 (3), (2009), 700-718. doi:10.1111/j.1468-2427.2009.00857.x Please refer to the published version when quoting the paper.
INTRODUCTIONThe UK space economy is back on research and policy agendas but in a new guise (Harrison, 2007).1 Through most of the twentieth century it was described in regional terms to inform policy needs that were essentially territorialist in nature: in Castells' (1996) thinking this was the national economy' as a space of places'. In this century the emphasis is moving towards spaces of flows' approaches that privilege the role of cities. This has rekindled research on identifying and describing the important cities in the space economy. For instance, Parkinson et al. (2006) have carried out a very detailed comparative study of English cities and Hall et al. (2001) have recalibrated the urban hierarchy in England and Wales. Both studies present a set of cities as key players in the major part of the UK space economy; in the former 56 primary urban areas' are selected on the basis of continuous built-up areas and demographic criteria (over 125,000 population), in the latter the top 35 cities' are identified from the higher echelons of the urban hierarchy defined in terms of retailing and other urban-centred services. The two sets of cities agree at the top end of their lists, but, going further down, many differences become apparent. This is to be expected given the different criteria for selection. We share with these studies the aim to identify leading urban areas in the national economy, but we are searching out a very specific set of cities and towns. In her classic study of the global city', Sassen (1991/2001) identified advanced producer services as key contributors to the success of major metropolitan areas in the world economy. Such financial, professional and creative work has become vital for facilitating capital expansion in economic globalization, and cities such as London have become both production centres and market centres for these business services. While it is true that a few important cities have become immense concentrations of advanced producer services, the work involved is not limited to a few select global cities'. To provide for their clients, the leading service firms have developed office networks in myriad cities across the world; these can be interpreted as defining a world city network (Taylor, 2001a). Such an interlocking network' has been measured and analysed for the year 2000 (Taylor, 2004a). The main output of this network analysis is a measurement of the network connectivities of cities, indicating the density of their integration into the world city network. An extension of this work has used its unique global data to assess the contemporary economic revival claims of UK provincial cities as reflected in their changing global network connectivities (Taylor and Aranya, 2006). In this study we follow a different approach that involves adapting the model and data collection to a lower (i.e. UK-national) scale of analysis. We build upon the use of the interlocking network model in the POLYNET' project, a major international research programme funded by the European Commission under the INTERREG IIIB (North West Europe) initiative (Hall and Pain, 2006). The purpose of POLYNET was to compare and analyse the polycentricity of eight emerging European mega-city regions' (Hall, 2001): South East England, the Randstad, Central Belgium, RhineRuhr, Rhine-Main, Northern Switzerland, the Paris Region and Greater Dublin. The interlocking network model was used to investigate inter-city relations within and beyond these regional clusters of cities. Although physically separate, cities in these clusters were found to be functionally networked through contemporary processes of economic globalization. To measure this polycentricity, POLYNET involved a major data collection exercise encompassing almost 2000 service firms and their offices across 200 cities (Taylor et al., 2006; 2008). The overall findings are reported in full in Hall and Pain (2006).2 In this paper we extend the POLYNET data and analysis from South East England to the whole of the UK. Thus we employ a very specific network interpretation of the UK space economy as practised by advanced producer services through their work in cities and towns. Such a specification can be interpreted in two ways. First, these service firms are important components of local city economies; in Sassen's argument they represent leading edge new work. However they will rarely be the dominant economic sector in a city. Nevertheless, second, they can be interpreted as a key indicator sector for the economic health of a city. An advanced producer service firm will only set up an office where there is a market for its products; a cluster of such firms in a city indicates a vibrant local economy. Their specific working practises, as service suppliers to each other as well as to other businesses, create complex inter-firm and cross-sector functional business linkages that benefit cities (Pain, 2007). Hence the UK space economy as practised by these service firms shows a geography of economic health and expected expansion. Note that this is an approach that is essentially process-based. Following Jacobs (1969) and Castells (1996), we treat cities as process, in this case external relations operating through network-making firms, which, in the advanced producer service sector, have distinctive propensities to create dynamic functional networks of cities. The key theoretical advantage of this way of thinking is to avoid reifying the city as network-maker (Taylor, 2006): The subject of the research are firms as agents, the object of the research are the cities and their interactions as outcomes. This distinction is also vital for any practical application of the research. The interlocking network model proved to be successful in elucidating mega-city region polycentricity comparisons in the POLYNET project, which addressed and linked two important European policy initiatives. First, the promotion of polycentricity is a key objective of European spatial planning to counter problems of uneven development at intra- and inter-regional scales (European Commission, 1999). Second, this approach identifies polycentric relationships that represent interactions in advanced knowledge-intensive services regarded as essential for Europe's global competitiveness in the Lisbon ' economic strategy (European Council, 2000). In this context, one particular POLYNET finding was the main stimulus for extending the analysis to the whole of the UK. The Paris and London city regions appear to operate in a surprisingly different way from the other six mega-city regions suggesting the operation of two different city processes: these are the two distinctive polycentric city-regional processes' of our sub-title. We set up this paper by outlining this intriguing finding. The argument then proceeds through five parts describing the new UK research. The second section explains in more detail the methodology and data collection upon which the research is based. In the next two sections different analyses are presented: a connectivity analysis that indicates how well cities and towns are linked into the UK space economy as defined here; and a fuzzy clustering analysis that classifies the cities and towns to search out hierarchical and regional tendencies in advanced producer service location. A fifth section interprets these new findings as reflecting two distinctive city processes that are described in some detail. A final concluding section considers the implications of the two processes for spatial planning in the UK arguing that two city processes require distinctive sets of policies. An Intriguing Finding: London and Paris in PolynetThe data on offices were collected for cities and towns at four geographical scales: regional (the mega-city region itself), national, European and global (Taylor et al., 2006; 2008). One original result from the POLYNET research was to show that the network connectivity of cities varied across these scales. For instance, in RhineRuhr, at the regional and national scales the two leading cities, Düsseldorf and Cologne, had very similar connectivities but at the European and global scales the former was much more connected (Schmitt and Knapp, 2006; Taylor et al., 2008). Thus, Cologne is the equal of Düsseldorf within Germany but Düsseldorf is much more important beyond Germany. More generally, it was found that, as the scale of analysis increased from regional to global, the dominance of the leading city in each mega-city region was enhanced (Taylor et al., 2008). In other words, the degree of polycentricity in a mega-city region is a function of scale. This is not in itself surprising we would expect the more local business to be shared and the more global business to be concentrated. But, to our knowledge, this has never been measured before. Table 1 presents this scale feature by showing polycentricity as the average connectivity of cities ranked 2 to 6 in each city region. These city connectivities are proportions of the first ranked city connectivity in each region and therefore absolute' polycentricity all six cities with equal connectivity would result in an average of 1.0. Thus the actual averages in Table 1 indicate how close each region is to this policy ideal and therefore constitute a simple measure of polycentricity. For instance, in Table 1, the two classic polycentric city regions, RhineRuhr and the Randstad, consistently have the highest polycentricity measures.
Table 1 Polycentricity for different geographical scales by mega-city region
Polycentricity is measured by the average network connectivity of the cities ranked 2 to 6 in a region. If these cities had the same connectivity as the first ranked city then the average would be 1.0 (absolute' polycentricity).The regions are ordered by their relative polycentricity at the regional scale. Source: derived from Taylor et al. (2007a)
The intriguing finding in this part of the POLYNET study is to be found in the rate of decline by scale shown in the final column of Table 1. These are gradients from regressing the polycentricity against scale (regional = 1, national = 2, Europe = 3, global = 4). The steepest gradient is for RhineRuhr: there is a fall of 0.189 in connectivity for every increase in scale. Among the variation in gradients two regions stand out: Paris' and South East England's gradients are conspicuous by their small size. The quantitative difference is such as to suggest a qualitative divergence: There are two different processes operating to produce these scale gradients. It cannot be a coincidence that the shallow gradients occur with Europe 's two premier world cities. As very large metropolitan areas with massive concentrations of advanced producer service firms, it appears that some of these functions are spilling over to a wider region. A regional diffusion of transnational service work appears to be happening in just these two regions but not elsewhere. This would account for the surprise that these two archetypal primate cities' are at the centre of regions with relatively high polycentricity at European and global scales of connectivity (ranked only after RhineRuhr and the Randstad with their long historical legacies of city clustering). The steeper gradients of the other six mega-city regions indicate a sharper fall-off in connectivities with scale: this appears to show that without a very large metropolitan centre, these mega-city regions operate differently from the Paris and London regions. This suggestion of two distinctive processes operating through mega-city regions is explored in this paper through extending the South East England data and analysis to the whole of the UK. The latter's space economy should be an ideal laboratory for investigating such a contrast given the enduring North versus South' geographical differences (Dunford, 1995; Dorling and Thomas, 2004). Considering the signs that recent globalization is effecting a revival outside the London region, we can see whether the patterns of connectivities across the UK indicate that globalization is creating two different city processes in this country. Methodology and DataIn reporting on previous research above, we have referred to the interlocking network model and data, and the network connectivities derived from them. Since the new extended UK POLYNET' research is based on these same ideas, we spell out our methodology in detail in this section. The Interlocking Network ModelMost networks operate as nodes connected to form a network; hence they have two layers, the net level and the nodal level. The interlocking network model is unusual in having three layers: as well as net (city network) and nodal (city) levels, there is a sub-nodal level (service firms). Furthermore, it is the latter who are the agents in the process of network formation. These are multi-city service firms who operate through office networks. In carrying out their everyday business they connect between cities through interactions of personnel, information, ideas, plans, knowledge, instruction, advice, etc. flowing through offices. These are intra-firm flows necessary for the creation of advanced knowledge products such as international advertising campaigns and inter-jurisdictional law contracts. Thus are contemporary cities interlocked' by these (largely) virtual links.3 Aggregating such flows from many service firms constitutes a city network. The world city network is formally derived from this basic argument in Taylor (2001a). Developed for studying the world city network, as previously noted this model was adapted to the mega-city regional scale for the POLYNET research and here we extend it specifically to a national space economy scale of the UK. Data: The Service Values MatrixThere are no comprehensive data available on actual flows between offices of advanced producer service firms.4 Therefore estimates of flow-levels have to be derived indirectly from data that is available. The location of firms' offices across the world is readily available on their web sites, which frequently also contain details of the size (e.g. number of law partners) and functions of offices (e.g. regional headquarters). From such material a picture can be drawn up about how a firm uses different cities where it has offices. This enables us to devise a coding scheme of service values' indicating the importance of a city to a firm's business practice. Using the same coding scheme for each firm, an n x m service values matrix can be constructed for n firms across m cities. This is the basic data requirement for interlocking network analysis. In the original world city network analysis data was collected for global service firms' in six sectors: accountancy, advertising, banking/finance, insurance, law, and management consultancy. The resulting service values matrix was 100 firms x 315 cities. Each cell had a service value ranging from 0 (for a city where a firm had no office) to 5 (the city housing a firm's headquarters). This data collection is described in detail in Taylor et al. (2002a). For the POLYNET research, due to the complexity of executing eight separate data collection exercises across the mega-city regions, the coded service values were simplified to just four categories: 0 for a city without an office; 1 for a city with a branch office or agent, 2 for a standard' office, and 3 for a headquarter. In addition, firms from two further service sectors were added to the data collection: design consultancy (architecture, civil engineering, planning) and logistical services (in particular those active in global integrated freight and supply chain management) (see Taylor et al., 2006). This research design has been adopted in the present study with additional criteria established to ensure a balanced UK coverage of the data. The selection of firms follows the process employed in the original POLYNET study for individual mega-city regions such as South East England. In effect the data from the latter have been nationalized' by extending the number of firms from 143 to 158. A wide range of sources were used to identify the universe of firms in the eight service sectors studied. These included international firm rankings (including the GaWC 100; Taylor et al., 2004), data provided by umbrella organizations, for example the CBI Directory of British Businesses, or sector specific directories such as the Legal500.com for law firms. To be included, firms had to be multilocational and have offices in at least two cities in the UK. Firms for which no office-specific information was available to differentiate between retail function and corporate business were omitted from the data. The choice of cities was dependent on the office network data. Offices of the 158 firms were identified in a total of 76 UK cities and towns. However, 14 of these housed just one office and were therefore not deemed important enough for inclusion. As a result of this process, the final matrix consisted of the office networks of 158 firms across 62 cities. This matrix was used to calculate network connectivities for all cities in the data (see Appendix). Network Connectivity AnalysesNetwork connectivities indicate how important a city is within a city network. This is best shown as a ranking of cities it implies a hierarchy but this is not strictly so since simply ranking cities is not a measure of power relations necessary for specifying a hierarchy (Taylor, 1997). In interpreting connectivity rankings we normally stay within our network framework but identify strata' of cities ordered classes to show what might be hierarchical tendencies within the city network (Taylor and Lang, 2005). The UK space economy's city network with hierarchical tendencies is shown in Table 2. The cities are divided into strata using gaps in the connectivity values. There are no surprises in the top strata; obviously London forms its own stratum at the very top and the next three strata consist of six English Core Cities5 and the four large non-English UK cities. After this predictable beginning, the remaining strata include some unlikely combinations placing well-known northern' cities with lesser known southern' cities and towns such as Liverpool (a Core City) and Milton Keynes, Sheffield (a Core City) and St Albans, and Stoke on Trent and Tunbridge Wells. These unlikely bedfellows reflect the long-term economic drift to the south' that Hall et al. (2001) report on but the sheer number of southern towns in the VII stratum indicates a process beyond what has previously been reported for north-south change in the twentieth century.
Table 2 Network connectivities and strata of UK cities
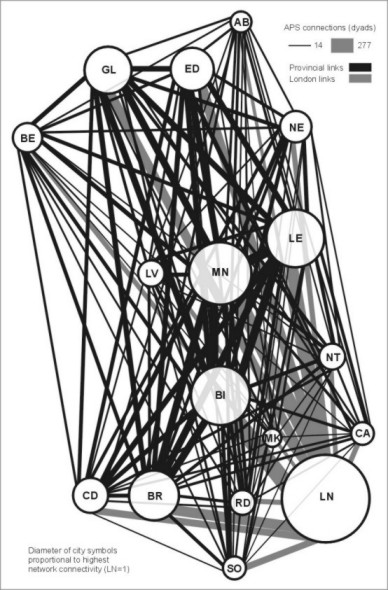
Figure 1 maps the detailed inter-city connections between the 17 cities that constitute the top five strata of Table 2. The dyad connections represent the UK space economy as practised by leading advanced producer service firms. London dominates clearly in this UK space of flows': its dyad connections constitute the strongest advanced producer services links for each of the cities mapped. However, at the national scale, strong inter-city links exist beyond the metropolitan pull of London. Manchester and Birmingham vie for second place, with all second highest links connecting one of the two. There is a clear regional bias in these connections: Manchester covers the North (Leeds, Liverpool, Newcastle) and large non-English UK cities (Glasgow, Edinburgh, Cardiff, Belfast); whereas the second strongest links of cities in the South are with Birmingham (Bristol, Reading, Southampton, Cambridge, Milton Keynes). Overall, the figure suggests a UK-wide pattern of inter-city relations that encompasses a wide range of cities beyond London and the greater South East'.
Figure 1 The UK space economy as practised by advanced producer services (APS)
City codes: AB Aberdeen, BE Belfast, BI Birmingham, BR Bristol, CA Cambridge, CD Cardiff, ED Edinburgh, GL Glasgow, LE Leeds, LN London, LV Liverpool, MK Milton Keynes, MN Manchester, NC Newcastle, NT Nottingham, RD Reading, SO Southampton Beyond Strata? Fuzzy Clustering AnalysisIn the study of the world city network, connectivity analyses were treated as a first step towards more sophisticated analyses showing the configuration of the data (Taylor, 2004a). It was found that beyond the strata as ordered classes, there were further patterns in the data, most conspicuously geographical patterns. Multivariate statistical analyses of a service values matrix treats each row of the matrix as a service profile, the mix of firms in the city: Cities with similar profiles are grouped into like classes. Many techniques exist to analyse large matrices for such a purpose: with the world city network matrix, principal components analysis (Taylor et al., 2002b), discriminant analysis (Taylor, 2004b), and fuzzy clustering analysis (Derudder et al., 2003) have been employed. Although results vary with different techniques, in general they were quite consistent for this matrix: city-groupings reflected both city strata (as measured by connectivity) and world-regional location. Overall, the fuzzy clustering algorithm turned out to be the best technique for showing the subtle interactions between strata and regionality (Derudder et al., 2003). Hence this is the technique we employ to search out city clusters in the UK service values matrix. There is also a technical reason for using this technique: Fuzzy clustering analysis copes particularly well with relative sparse matrices (many zeros) such as the one we have produced here (Derudder et al., 2007). In a fuzzy clustering analysis every city is allocated to every class or cluster but with varying degrees of membership ranging from 0 to 1. In practice, low membership scores are interpreted as a city effectively not belonging to a cluster. In the analyses reported here we discount all memberships below 0.25. The remainder are divided into three quartile categories: a city with a membership score above 0.75 is deemed to be a core member of the cluster; scores from 0.5 to 0.74 constitute ordinary cluster membership; and cities with scores from 0.25 to 0.49 are considered peripheral members of the cluster. The choice of number of clusters to interpret is important because different numbers can yield different pertinent outcomes. The decision is inevitably subjective; after some experimentation we settled on six clusters of cities as the most salient result.6
Table 3 The three leading clusters from the fuzzy clustering analysis
Table 4 The three lower clusters from the fuzzy clustering analysis
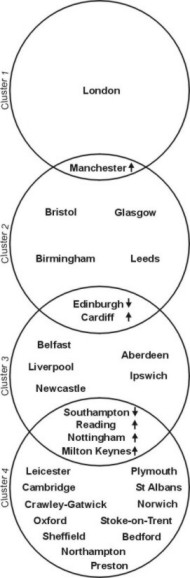
The six clusters of cities are shown in Tables 3 and 4 where they are ordered by their average connectivity. The results broadly mimic the connectivity analysis (Table 2). This is especially the case with the three higher level clusters (Table 3): London is nearly its own cluster with, interestingly, Manchester in its far periphery; and the other two clusters consist largely of English Core Cities and the four leading non-English UK cities. The contribution that the fuzzy clustering analysis adds to a classification is in the overlapping of cities across clusters. This allows the ordering of cities to be portrayed as a simple Venn diagram. Figure 2 shows that advanced producer service practice is quite sensitive to inter-city relations in the way that overlap cities' appear to provide very appropriate links' between sets in Manchester, Cardiff, Reading, Nottingham and Milton Keynes stretching above their main clusters, and Edinburgh and Southampton stretching below.
Figure 2 Four leading clusters and overlap cities' |
|||||||||||||||||||||||||||||||||||||||||||||||||||||||||||||||||||||||||||||||||||||||||||||||||||||||||||||||||||||||||||||||||||||||||||||||||||||||||||||||||||||||||||||||||||||||||||||||||||||||||||||||||||||||||||||||||||||||||||||||||||||||||||||||||||||||||||||||||||||||||||||||||||||||||||||||||||||||||||||||||
Place |
% London * |
Newbury Bournemouth Solihull Southampton Peterborough Wimbourne St Albans Leeds |
18 16 15 14 13 12 11 10 |
*Percentage of links with London to total links
There are two features of this new mega-city regional process that differ from previous London city regions. First, it reaches far beyond the traditional London city region and clearly extends beyond the South East standard region, even the phrase greater South East' appears inadequate to describe London 's spatial imprint as a global city within the UK. Second, it has encompassed several large cities that are themselves becoming important advanced producer service centres: Reading, Southampton, Cambridge and Milton Keynes are listed with two Core Cities (Liverpool and Nottingham) in Table 2 as Strata V, which is ranked above another Core City (Sheffield) in Strata VI. Thus the current economic expansion of London is creating a large functionally polycentric mega-city region that interlocks a cluster of cities: the global city of London, plus other key business service centres.
Multi-city regional processes derive from historical legacies of clusters of important cities. The classic cases are the Randstad and RhineRuhr. In such cases new economic expansion occurs across both the leading city in the cluster and the other cities so that polycentricity is their hallmark. This contemporary multi-city regional process in Europe has led to debates as to its nature with evidence that cities are becoming more alike in their sectoral composition (Kloosterman and Lambregts, 2001) and other evidence suggesting continuing specialization between cities. For example, cities in the Rhine-Main region display both a sectoral and functional division of labour in advanced producer services that is reflected in their specific national and transnational connectivity patterns (Hoyler et al., 2008a).
Of course, clusters of cities developed in the northern British industrial revolution but since these cities declined through most of the twentieth century there has been little concern to see them as polycentric city regions until recently. In fact, it is not the distinctive industrial regions (Lancashire cotton textile region, West Yorkshire woollen textile region, etc.) that are the current focus but the combination of their major cities as a Northern Way ' for balancing the economic power of London (Taylor et al., 2007). This broader geographical focus is supported by the polycentric multi-city regional process and one particularly effective way of showing this is through inspection of the cities we have omitted. Comparing our list of English cities and towns8 with the ODPM's 56 primary urban areas (PUAs; Parkinson et al., 2006) and Hall et al.'s (2001) 46 hierarchy cities9 we find 36 cities of the UK POLYNET list overlap with the other two lists.10 In Table 6 missing cities and towns are listed; 15 that we alone have identified and 28 that the other lists have but we have not. The 15 places unique to our study confirm our previous identification of an enhanced southern presence, the polycentric mega-city regional process. The 28 cities missing from our list show places deemed important in the other studies but where advanced producer service firms are not choosing to locate. There are a few declining coastal cities in the south (Hall et al. (2001) also note this exceptional southern decline) but otherwise the missing cities are in the midlands and the north. And they include some large important cities such as Bolton, Bradford, Coventry and Sunderland. There seems to be a shadow effect': these four cities are close to other more important cities that have attracted advanced producer service firms: Manchester, Leeds, Birmingham and Newcastle respectively. Here there is no evidence of a spread of the service expansion, even to large cities, in comparison to London where even relatively small towns appear in the first column of Table 6.
Table 6 Missing English cities and towns: comparing the UK POLYNET list with ODPM PUAs and Hall's combined hierarchy
Places found only on UK POLYNET list
|
Places in other lists but not in UK POLYNET list |
Basingstoke |
Barnsley * |
* ODPM primary urban area (Parkinson et al., 2006)
** Hall et al. (2001) hierarchy city
Note. The following places in the UK POLYNET list are encompassed in ODPM PUAs: Bromley, Dartford and Epsom in London; Fareham in Portsmouth; Farnborough in Aldershot; and Solihull in Birmingham. Also Wolverhampton from Hall's hierarchy is in the Birmingham PUA.
Clearly where this shadow effect occurs, the rise of advanced producer services is very different from the polycentric mega-city regional process. Inherently polycentric, the multi-city regional process produces successful major cities but bypasses many previously important cities as found especially in the RhineRuhr and Randstad regions in the POLYNET study. Thus whereas the service expansion out of London has helped to create new important service centres and has even reached selected smaller cities and towns, the polycentric multi-city regional process beyond London is largely about enhancing the service capacities of selected larger cities.
Taking the world city literature as our guide, we have studied the UK space economy in a quite specific way by using advanced producer service firms to delineate a city-centred space of flows. Thus our results diverge from other recent studies of cities in Britain and rely for their salience on the theoretical underpinning of the measurements we have conducted. What we have attempted to do is place the UK space economy in a globalization context as conceptualized by Castells' (1996) network/informational society. This treats cities as process and our focus on inter-city relations has enabled us to identify two distinctive polycentric regional processes. This finding brings the relative size of the advanced producer service concentrations to the fore: with the very largest Sassen's (1991/2001) global cities' like London, we suggest a Jacobs-style (1984) polycentric mega-city regional process; with other concentrations there is a polycentric multi-city regional process. These ideas were originally derived from the European POLYNET study (Hall and Pain, 2006) and have been related to US polycentric city-regions (Taylor and Pain, 2007) implying our findings above can be generalized beyond the UK. But our results also have direct and explicit relevance to UK spatial planning: The evidence for two distinctive processes requires spatial planners to think creatively about different types of policy to address their specific needs. The key point is that this is a far cry from past regional planning or more recent territorially competitive regionalism'. The findings of this paper are not simply a contemporary scripting of the traditional north-south divide'.
Our approach to delineating new economic spaces is similar in spirit to the research commissioned by the Royal Town Planning Institute into polycentric regions, directed by Cecilia Wong at the University of Manchester (RTPI, 2006). The aim of this study has been to inform a national spatial planning framework, something that is currently absent, with the exception of the Government Sustainable Communities Strategy' and its subsequent formulations (ODPM, 2003a; 2003b; 2005). Such a perspective is needed to co-ordinate intervention and investment that are currently outside the remit of regional and local planning bodies. The key finding of the RTPI research is the identification of six functional spatial clusters' comprising between nine and sixteen major towns and cities (RTPI, 2006: 53). The policy implication derives from the fact that these economic spaces do not fit the existing statutory planning areas. This repeats a key POLYNET cross boundary finding (e.g. Gabi et al., 2006; Hoyler et al., 2006): In the case of South East England, the mega-city region is dissected by multiple regional (Regional Assembly and Regional Development Agency) strategy boundaries (Pain et al., 2006). But here the similarity with our research ends. The RTPI (2006) report does not encompass any data on inter-city business interactions and flows. Thus from our theoretical position, it is the latest attempt to map UK spaces of places and as such is at best an incomplete framework for policy and planning under conditions of contemporary globalization.
To achieve the latter requires policy thinking to replace territory (absolute bounded spaces) by process (overlapping, relational spaces). The focus on cities as process rather than their place characteristics is important because processes can happen simultaneously in the same place. Thus you do not draw boundary lines between processes; as we have shown, the London mega-city process has affected cities beyond the south'. This implies that to meet the needs of new complexities consequent upon economic globalization, a new kind of strategic spatial planning is required that can handle overlaps' in process (see also Healey, 2007).
Castells, M. (1996) The rise of the network society. Blackwell, Oxford.
Combes, P.P., G. Duranton, H.G. Overman and A.J. Venables (2006) Economic linkages across space. Office of the Deputy Prime Minister, London.
Derudder, B., P.J. Taylor, F. Witlox and G. Catalano (2003) Hierarchical tendencies and regional patterns in the world city network: a global urban analysis of 234 cities. Regional Studies 37.9, 875-86.
Derudder, B., F. Witlox, P.J. Taylor and G. Catalano (2007) Fuzzy classifications in large geographical databases: towards a detailed assessment of the world city network. International Journal of Pattern Recognition and Artificial Intelligence 21.3, 439-62.
Dorling, D. and B. Thomas (2004) People and places: a 2001 census atlas of the UK. Policy Press, Bristol.
Dunford, M. (1995) Metropolitan polarization, the North-South divide and socio-spatial inequality in Britain: a long-term perspective. European Urban and Regional Studies 2.2, 145-70.
European Commission (1999) ESDP: European spatial development perspective: towards balanced and sustainable development of the territory of the European Union. European Commission, Brussels.
European Council (2000) Presidency conclusions Lisbon European Council, 23 and 24 March. http://ue.eu.int/ueDocs/cms_Data/docs/pressData/en/ec/00100-r1.en0.htm Keydocuments: http://europa.eu.int/growthandjobs/key/index_en.htm
Gabi, S., A. Thierstein, C. Kruse and L. Glanzmann (2006) Governance strategies for the Zürich-Basel metropolitan region in Switzerland. Built Environment 32.2, 157-71.
Halbert, L., F. Convery and A. Thierstein (eds.) (2006) Reflections on the polycentric metropolis (special issue). Built Environment 32.2, 105-220.
Hall, P. (2001) Global city-regions in the twenty-first century. In A.J. Scott (ed.), Global city-regions: trends, theory, policy, Oxford University Press, Oxford.
Hall, P., S. Marshall and M. Lowe (2001) The changing urban hierarchy in England and Wales, 1913-1998. Regional Studies 35.9, 775-807.
Hall, P. and K. Pain (eds.) (2006) The polycentric metropolis: learning from mega-city regions in Europe. Earthscan, London.
Harrison, J. (2007) From competitive regions to competitive city-regions: a new orthodoxy, but some old mistakes. Journal of Economic Geography 7.3, 311-32.
Healey, P. (2007) Urban complexity and spatial strategies: towards a relational planning for our times. Routledge, London.
Hoyler, M., T. Freytag and C. Mager (2006) Advantageous fragmentation? Reimagining metropolitan governance and spatial planning in Rhine-Main. Built Environment 32.2, 124-36.
Hoyler, M., T. Freytag and C. Mager (2008a) Connecting Rhine-Main: the production of multi-scalar polycentricities through knowledge-intensive business services. Regional Studies 42.8, 1095-111.
Hoyler, M., R.C. Kloosterman and M. Sokol (eds.) (2008b) Globalization, city-regions and polycentricity in North-West Europe (special issue). Regional Studies 42.8, 1055-217.
Jacobs, J. (1969) The economy of cities. Random House, New York.
Jacobs, J. (1984) Cities and the wealth of nations. Random House, New York.
Jones, A., L. Williams, D. Coats, N. Lee and A. O'Keeffe (2006) Enabling cities in the knowledge economy. Department for Communities and Local Government, London.
Kloosterman, R.C. and B. Lambregts (2001) Clustering of economic activities in polycentric urban regions: the case of the Randstad. Urban Studies 38.4, 717-32.
Marvin, S., A. Harding and B. Robson (2006) A framework for city-regions. Office of the Deputy Prime Minister, London.
Morton, H.V. (1960) In search of England. Penguin, Harmondsworth.
ODPM (Office of the Deputy Prime Minister) (2003a) Sustainable communities: building for the future. Office of the Deputy Prime Minister, London.
ODPM (Office of the Deputy Prime Minister) (2003b) Creating sustainable communities: making it happen: Thames Gateway and the growth areas. Office of the Deputy Prime Minister, London.
ODPM (Office of the Deputy Prime Minister) (2005) Sustainable communities: people, places and prosperity. Office of the Deputy Prime Minister, London.
Pain, K. (2007) City of London global village: understanding the Square Mile in a post-industrial world economy. In S. Barber (ed.), The geo-politics of the City, Forumpress, London.
Pain, K. (2008) Examining core-periphery' relationships in a global city-region: the case of London and South East England. Regional Studies 42.8, 1161-72.
Pain, K., P. Hall, G. Potts and D. Walker (2006) South East England: global constellation. In P. Hall and K. Pain (eds.), The polycentric metropolis: learning from mega-city regions in Europe, Earthscan, London.
Parkinson, M., T. Champion, J. Simmie, I. Turok, M. Crookston, B. Katz and A. Park (2006) State of the English cities. Office of the Deputy Prime Minister, London.
RTPI (Royal Town Planning Institute) (2006) Uniting Britain: the evidence base spatial structure and key drivers. The Royal Town Planning Institute, London.
Sassen, S. (1991/2001) The global city. Princeton University Press, Princeton, NJ.
Schmitt, P. and W. Knapp (2006) RheinRuhr als polyzentrischer Raum der Orte im Raum der Ströme. Zeitschrift für Wirtschaftsgeographie 50.3-4, 217-31.
Taylor, P.J. (1997) Hierarchical tendencies amongst world cities: a global research proposal. Cities 14.6, 323-32.
Taylor, P.J. (2001a) Specification of the world city network. Geographical Analysis 33.2, 181-94.
Taylor, P.J. (2001b) Which Britain ? Which England ? Which North? In D. Morley and K. Robins (eds.), British cultural studies, Oxford University Press, Oxford.
Taylor, P.J. (2004a) World city network: a global urban analysis. Routledge, London.
Taylor, P.J. (2004b) Regionality in the world city network. International Social Science Journal 56.181, 361-72.
Taylor, P.J. (2006) Parallel paths to understanding global intercity relations. American Journal of Sociology 112.3, 881-94.
Taylor, P.J. and Aranya, R. (2006) Connectivity and city revival. Town & Country Planning 75.11, 309-14.
Taylor, P.J., G. Catalano and D.R.F. Walker (2002a) Measurement of the world city network. Urban Studies 39.13, 2367-76.
Taylor, P.J., G. Catalano and D.R.F. Walker (2002b) Exploratory analysis of the world city network. Urban Studies 39.13, 2377-94.
Taylor, P.J., G. Catalano and D.R.F. Walker (2004) Multiple globalisations: regional, hierarchical and sectoral articulations of global business services through world cities. Service Industries Journal 24.3, 63-81.
Taylor, P.J., D.M. Evans and K. Pain (2006) Organization of the polycentric metropolis: corporate structures and networks. In P. Hall and K. Pain (eds.), The polycentric metropolis: learning from mega-city regions in Europe, Earthscan, London.
Taylor, P.J., D.M. Evans and K. Pain (2008) Application of the inter-locking network model to mega-city regions: measuring polycentricity within and beyond city-regions. Regional Studies 42.8, 1079-93.
Taylor, P.J., M. Hoyler, D.M. Evans and J. Harrison (2007) Balancing London ? A preliminary investigation of the Core Cities' and Northern Way' spatial policy initiatives using multi-city corporate and commercial law firms. GaWC Research Bulletin 224, http://www.lboro.ac.uk/gawc/
Taylor, P.J. and R.E. Lang (2005) US cities in the world city network. The Brookings Institution (Survey Series), Washington, DC.
Taylor, P.J. and K. Pain (2007) Polycentric mega-regions: exploratory research from Western Europe. In A. Carbonell, P. Todorovich and R. Yaro (eds.), The Healdsburg research seminar on megaregions. Briefing papers and report, Regional Plan Association and the Lincoln Institute of Land Policy, New York.
Trauwaert, E. (1988) On the meaning of Dunn's partition coefficient for fuzzy clusters. Fuzzy Sets and Systems 25.2, 217-42.
Wu, K.-L. and M.-S. Yang (2005) A cluster validity index for fuzzy clustering. Pattern Recognition Letters 26.9, 1275-91.
Network connectivities are the primary output from an interlocking network analysis. The measure is an estimate of how well connected a city is within the overall network. It is based on the assumption that cities with more important offices generate more flows than cities with less important offices. Taking any pair of cities, the service values of each firm in both cities are multiplied. The sum of these products between any pair of cities indicates the potential for advanced servicing including the two cities. These dyad connections are of interest in their own right and can be mapped to show the space economy as a space of flows. The network connectivity of a city is then computed as the sum of all its dyad connections (Taylor, 2001a; for a worked example see Taylor et al., 2008). Thus a city like London or Amsterdam with very many important offices (high service values) will have a high network connectivity whereas a city like Sheffield or Utrecht with rather less offices, most not especially important (low service values), will score much lower on connectivity. With large service value matrices, network connectivities based upon sums of products create quite large numbers, and to ease interpretation they are usually presented as proportions of the highest scoring city thus providing a range between zero and unity. This is very convenient for comparing across analyses, which is what was done (as averaged network connectivities) for the POLYNET research in Table 1.
* Peter J. Taylor, David M. Evans, Michael Hoyler and Kathy Pain, Department of Geography, Loughborough University, UK; Ben Derudder, Department of Geography, Ghent University, Belgium
1. The recent re-emergence of Government interest in regional policy was illustrated by the 2006 publication by the Office of the Deputy Prime Minister (ODPM) of three especially commissioned studies (Combes et al., 2006; Marvin et al., 2006; Parkinson et al., 2006). Parkinson et al. (2006) focused on the city-region scale and its significance for the UK economy and we refer to this report in the paper. Combes et al. (2006) attempted to develop an analytical framework to measure economic linkages across space but this is based on formal theoretical modelling and does not refer to empirical evidence on the practises of business actors. A more recent independent report by the Work Foundation (Jones et al., 2006), published by the Department for Communities and Local Government (DCLG), focuses on the implications of the knowledge economy for policy but is explicitly place (city and city-region) oriented and does not draw on evidence of inter-city business relations. Our focus in this paper is in producing theoretically informed empirical measures of the latter.
2. The POLYNET: Sustainable Management of European Polycentric Mega-City Regions' research (Hall and Pain, 2006) investigated the emergence of large polycentric mega-city regions' a feature of advanced service economy informational flows' between cities in the densely urbanized North West of the European Union. Together, five empirical studies analyzed the implications of dynamic, multi-scale spaces of flows' for this economically important European space of places'. These included quantitative analyses of personal movements (commuting and business travel), business network connections and telecommunications traffic, as well as qualitative analyses of business linkages and policy contexts. The GaWC interlocking network model provided the theoretical input and primary data to inform policy and planning on the mega-city region as process (see also Halbert et al., 2006; Hoyler et al., 2008b).
3. Related physical flows of people through commuting and business travel associated with multi-city service network interactions are discussed fully in Hall and Pain (2006).
4. An attempt was made in the POLYNET project to measure directly, through a web survey, virtual communication flows (telephone and e-mail traffic, video and phone conferencing) and business journeys of senior staff in advanced producer service firms. However, this approach was fraught with conceptual and technical difficulties, and no comprehensive dataset could be gained from the exercise (Hall and Pain, 2006).
5. The Core Cities group is a strategic alliance of England 's major regional cities and includes Birmingham, Bristol, Leeds, Liverpool, Manchester, Newcastle, Nottingham and Sheffield.
6. A more objective way of selecting the optimal' number of clusters may be reached through the application of so-called validity indexes. Such coefficients are used to evaluate the fitness of partitions produced by fuzzy clustering algorithms. Trauwaert (1988), for instance, has suggested that the optimal' number of clusters can be found through maximizing Dunn's coefficient, which measures the hardness' (i.e. the lack of fuzziness') in the clustering results. The underlying idea is that hard' results (i.e. average memberships close to 0 and 1) are ideal in that they can easily be interpreted, while the meaning of fuzzy' results (i.e. average memberships that are neither close to 0 or 1) is hard to establish. In other words, it is suggested that in this specific case indicators such as Dunn's coefficient make it possible to compare the average certainty with which each of the cities is allocated to a cluster for each of the consecutive clustering results. However, it can equally be argued that this interpretation confuses mathematical fuzziness with conceptual vagueness: Dunn's coefficient may well point us to the most interpretable result in mathematical terms, but this is not necessarily the most meaningful result in conceptual terms. We therefore opted for a pragmatic choice after assessing several solutions for different numbers of clusters. For more recent mathematical approaches in this context, see Wu and Yang (2005).
7. A large number of such interviews were undertaken in the European POLYNET study. The results for South East England are reported in Pain et al. (2006) and Pain (2008). These interviews provide more in-depth insight into the complexities of concentration and dispersal of advanced producer service functions in London and the South East region. They focus, however, on office locations in London and surrounding urban centres and therefore lack the wider UK perspective adopted in the research reported here.
8. We cannot compare across the UK because the ODPM study covers only England and the Hall et al. (2001) study only England and Wales.
9. Hall et al. (2001) produce two combined urban and retail hierarchies, there are 46 cities that occur in at least one of these two combinations.
10. 29 cities are in all three lists, four cities are in the ODPM and UK POLYNET lists, and another three cities in the Hall et al. (2001) and UK POLYNET lists.
Edited and posted on the web on 4th June 2007; last update 23rd June 2009
Note: This Research Bulletin has been published in International Journal of Urban and Regional Research, 33 (3), (2009), 700-718